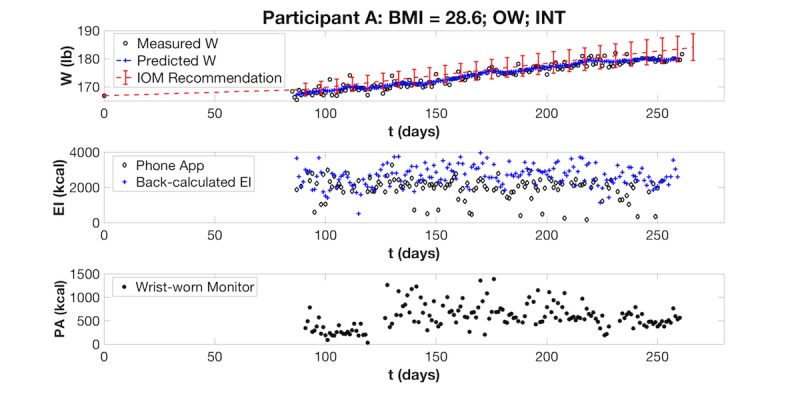
Figure 5.

Preliminary visualization of a Healthy Mom Zone Intervention participant’s gestational weight gain data. The intervention participant’s measured weight is plotted against her predicted weight (based on the computerized applet) and the Institute of Medicine upper and lower ranges for recommended weight gain for a woman who is OW. Her EI (measured with phone app and estimated with a back-calculation formula) and PA (measured with wrist-worn activity monitor) are also plotted. BMI: body mass index; OW: overweight; INT: intervention participant; W: weight; EI: energy intake; PA: physical activity; kcal: kilocalories.
