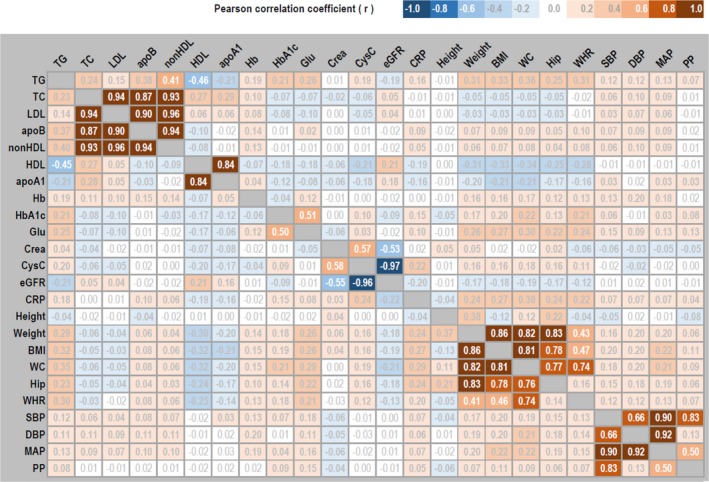
Figure 1.

Phenotypic correlation matrix among 24 cardiometabolic traits. Statistically significant (P<0.05) estimates of Pearson correlation coefficient (r) are boldfaced. Estimates in the top triangle are from the 3870 complete twin pairs used in twin models, and estimates in the bottom triangle are from the 5779 unrelated individuals used in single‐nucleotide polymorphism models. apoA1 indicates apolipoprotein A1; apoB, apolipoprotein B; BMI, body mass index; Crea, creatinine; CRP, C‐reactive protein; CysC, cystatin C; DBP, diastolic blood pressure; eGFR, estimated glomerular filtration rate; Glu, fasting glucose; Hb, hemoglobin; HDL, high‐density lipoprotein; Hip, hip circumference; LDL, low‐density lipoprotein; MAP, mean arterial pressure; PP, pulse pressure; SBP, systolic blood pressure; TC, total cholesterol; TG, triglycerides; WC, waist circumference; WHR, waist/hip ratio.
