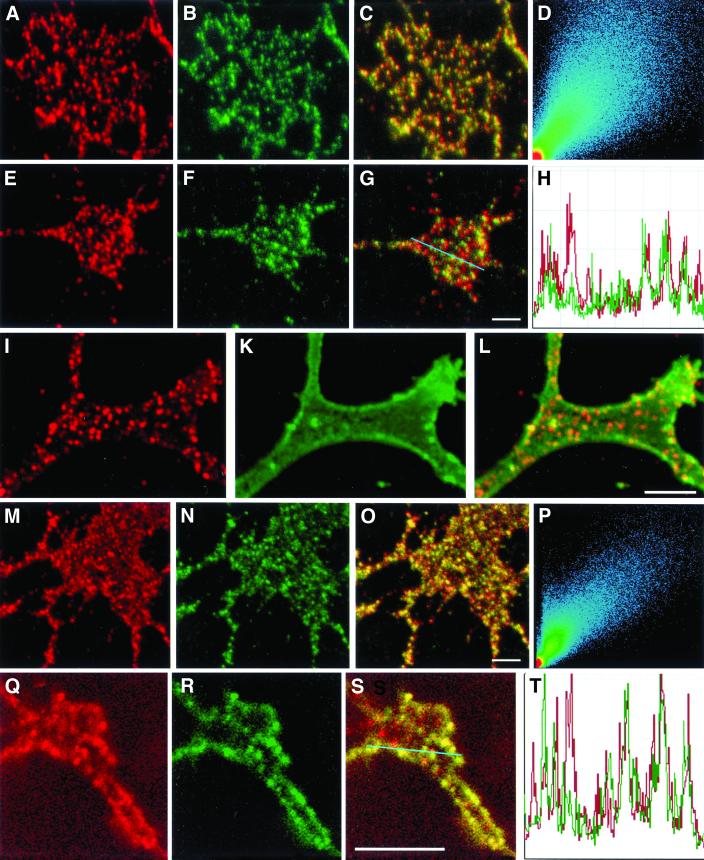
Figure 5.
Colocalization of reggie and F3, reggie and Thy-1, and fyn. After AB cross-linking, F3 immunostaining (a, red) in DRG growth cones closely resembles anti-reggie-1 labeling (b, green). Colocalization of F3 and reggie-1 staining is demonstrated by superposition of red and green channel images (c) as well as in the corresponding scatter plot (d). (e) Fyn immunoreactivity (red) also shows a punctate pattern in growth cones, like that of reggie-1 (f, green). Partial colocalization of fyn and reggie-1 is evident from the superimposed images (g, yellow dots) and a profile of both immunostaining patterns (h), along the blue line in (q). PC12 cell growth cone labeled with anti-reggie-1 (i, red) and showing its typical dotted distribution (I and l), whereas labeling with anti-Thy-1 before cross-linking results in a homogenous distribution (k, green). Cross-linking of Thy-1 results in a punctate distribution (n, green) resembling that of anti-reggie-1 (m, red) and with substantial colocalization of reggie-1 and Thy-1, as is reflected by the superposition of the two images (o, yellow dots) and the corresponding scatter plot (p). Staining of PC12 growth cone with anti-fyn gives a punctate distribution (q, red) like that emerging after cross-linking of Thy-1 (r, green). The merger of the images (s, yellow dots) shows partial colocalization of fyn and Thy-1, which is also seen in the distributional profile (t, across the blue line in s). Bars: 2 μm.

