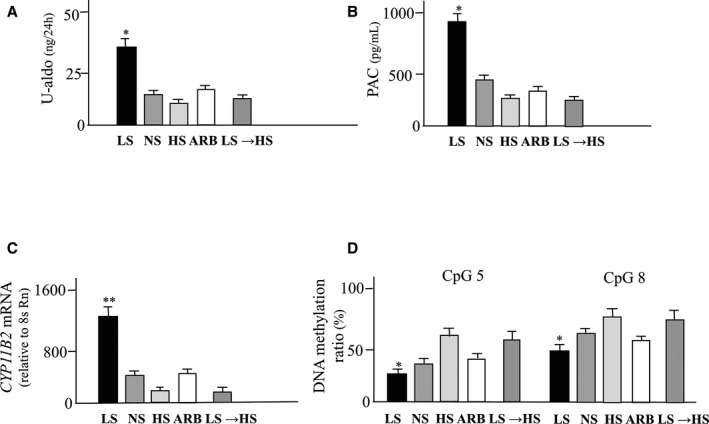
Figure 8.

Effects of a low‐salt diet on aldosterone synthesis and methylation of CYP11B2. A, Urinary excretion of aldosterone (U‐aldo); (B) Plasma aldosterone concetration (PAC); (C) CYP11B2 mRNA levels; (D) DNA methylation ratios. Values are means±SEM. **P<0.01 vs NS, HS, ARB and LS →HS; *P<0.05 vs NS, HS, ARB and LS →HS. ARB indicates Angiotensin II type1 receptor antagonist; HS, high salt diet; LS, low salt diet; LS →HS, rats switched from LS to HS; NS, normal salt diet.
