
Figure 5.
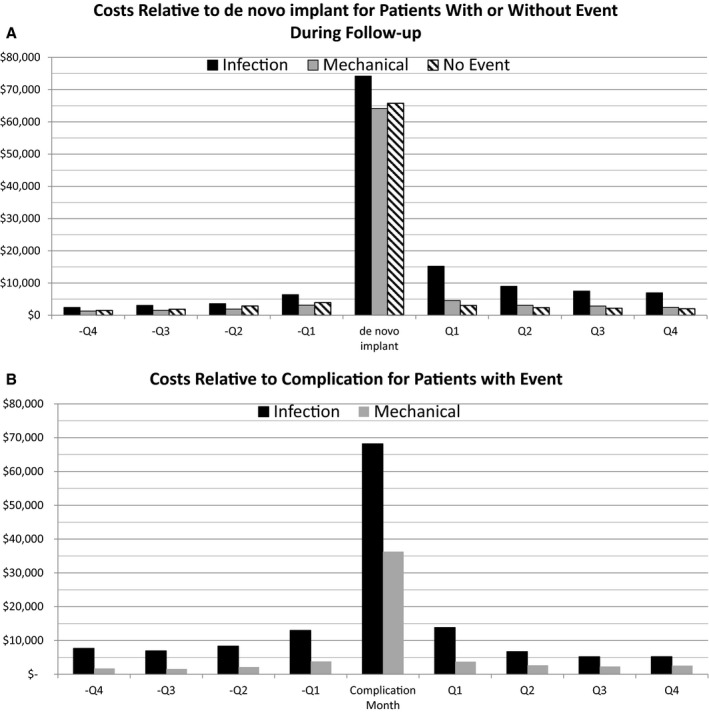
Costs relative to de novo and complication procedure. The costs during the de novo procedure month (top) and the complication procedure month (bottom) grouped by type of complication the patient experienced during follow‐up. Months before and after procedure are shown in quarters (Qs).