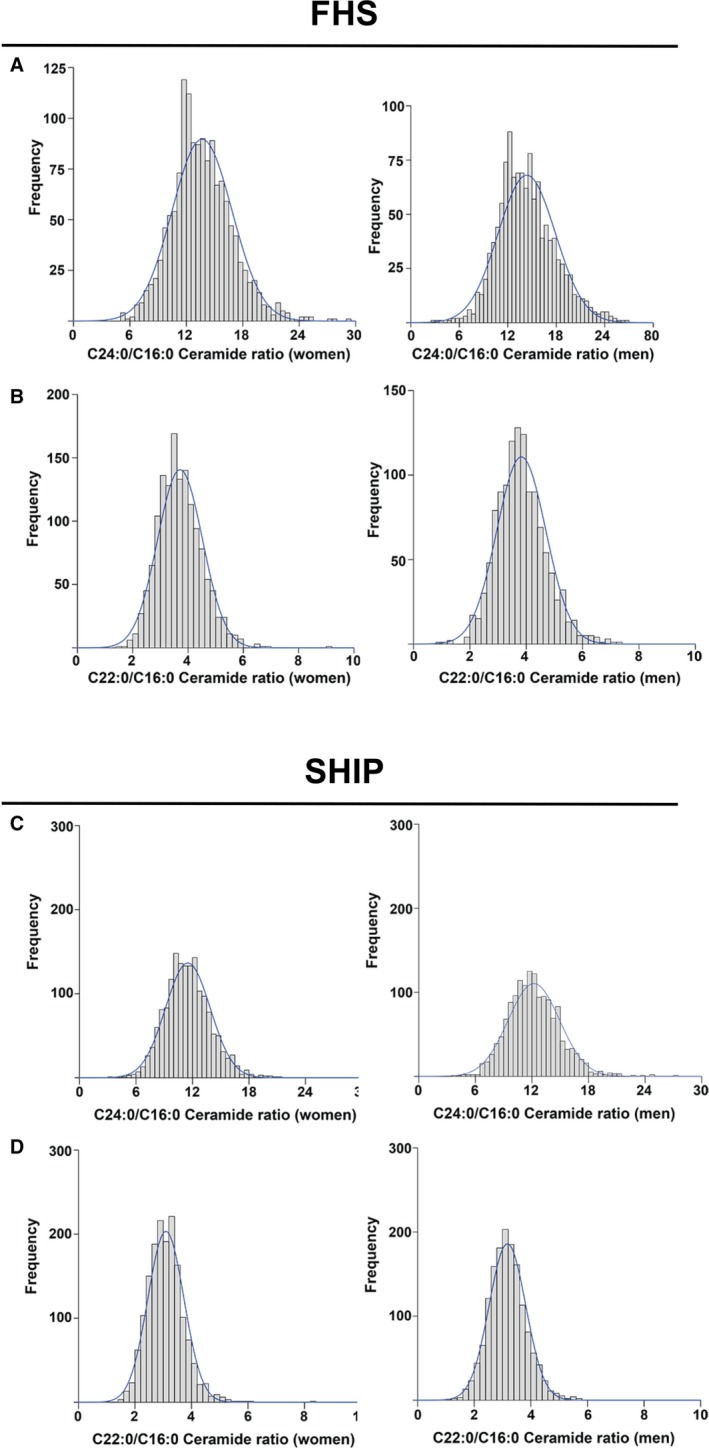
Figure 1.

Distributions of plasma ceramide ratios in FHS (Framingham Heart Study) and SHIP (Study of Health in Pomerania). Plots display distribution of values for C24:0/C16:0 (A and C) and C22:0/C16:0 (B and D) ceramide ratios in female and male FHS participants at examination 8 (A and B) and in SHIP participants at SHIP‐1 examination (C and D).
