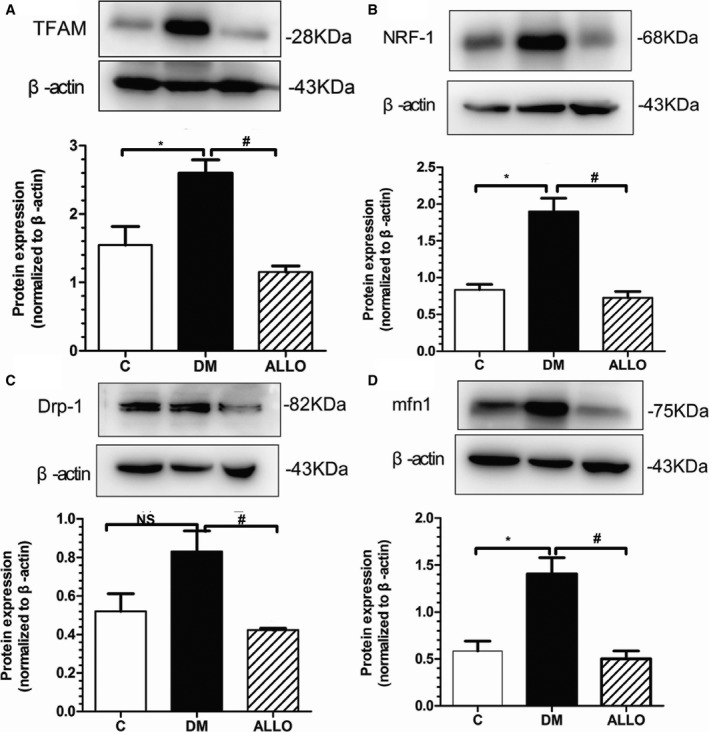
Figure 3.

Mitochondrial‐related protein expression in LA tissue. A through D, Representative Western blot analysis of the protein expression in the 3 groups. (A) TFAM, (B) NRF‐1, (C) Drp‐1, (D) mfn1. Data are means±SD, relative protein level was normalized to β‐actin. *Compared with the control group P<0.05. #Compared with the DM group P<0.05. DM indicates diabetes mellitus; NS, not significant; TFAM, mitochondrial transcription factor A.
