
Figure 4.
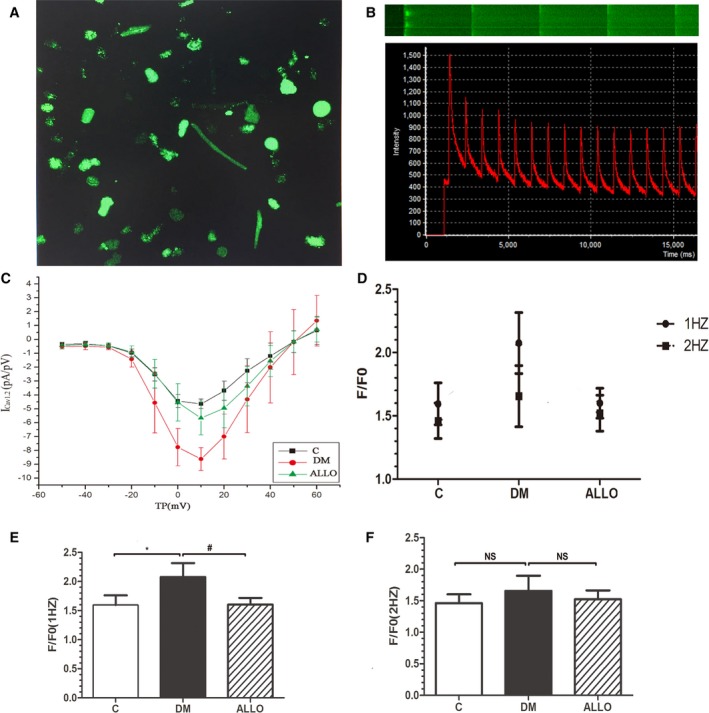
Current‐voltage (I–V) curve for ICaL density obtained using patch clamping (C). [Ca2+]i transients measured by confocal microscopy (A, B, D through F). Representative images by flat scanning (A) and line scanning (B upper) and representative curve graph of [Ca2+]i transients (B bottom). The mean magnitudes of [Ca2+]i transients during 1 Hz (E) or 2 Hz (F) field stimulation and comparison of them (D). Data are presented as mean±SD. *Compared with the control group P<0.05. #Compared with DM group P<0.05. DM indicates diabetes mellitus; NS, not significant.