
Figure 1.
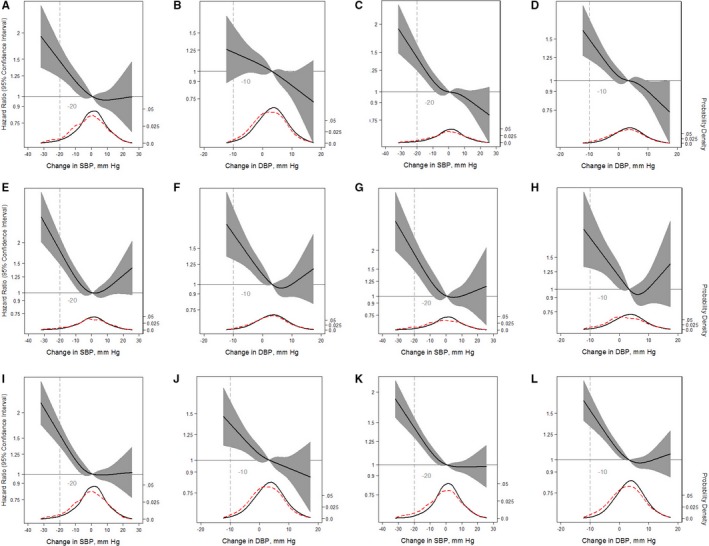
Adjusted restricted cubic splines of the relationship (solid line) between postural change in systolic blood pressure (SBP) or diastolic blood pressure (DBP; per mm Hg) with incident myocardial infarction (A and B), incident congestive heart failure (C and D), incident stroke (E and F), fatal coronary heart disease (G and H), any coronary heart disease (I and J), and mortality from any cause (K and L). Participants were followed up through December 31, 2015. The models were expressed relative to the 50th percentile of postural change in SBP or DBP (0.85 and 3.5 mm Hg, respectively), with 4 knots specified using Harrell's method. All models used Cox proportional hazards models to determine hazard ratios shown on natural log scale and were adjusted for age, sex, race‐center, estimated glomerular filtration rate, body mass index, resting heart rate, high‐density lipoprotein cholesterol, low‐density lipoprotein cholesterol, triglycerides, total cholesterol, diabetes mellitus status, hypertension status, antihypertensive medication use in the past 2 weeks, self‐reported dizziness, alcohol consumption, education level, physical activity, and smoking status. The plot was truncated at the 0.5th and 99.5th percentiles of postural change in SBP or DBP. In addition, overlaid are kernel density plots depicting the distribution of postural change in systolic or diastolic blood pressure by participants who had the outcome of interest (red dash) vs those who did not have the outcome of interest (solid).