
Figure 2.
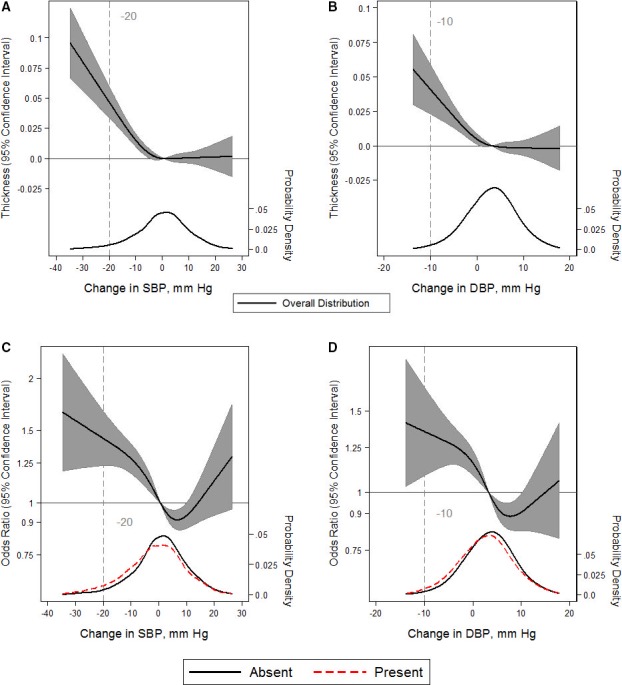
Adjusted restricted cubic splines of the relationship (solid line) between postural change in systolic blood pressure (SBP) or diastolic blood pressure (DBP; per mm Hg) with carotid intimal thickness (measured in mm; A and B) or the presence of carotid plaque (C and D). Gray shade represents 95% confidence intervals. The models were expressed relative to the 50th percentile of postural change in SBP or DBP (0.85 and 3.5 mm Hg, respectively), with 4 knots specified using Harrell's method. Linear regression was used for carotid intimal thickness. Logistic regression was used for the presence of carotid plaque (odds ratios shown on natural log scale). Linear or logistic regression models were adjusted for age, sex, race‐center, estimated glomerular filtration rate, body mass index, resting heart rate, high‐density lipoprotein cholesterol, low‐density lipoprotein cholesterol, triglycerides, total cholesterol, diabetes mellitus status, hypertension status, antihypertensive medication use in the past 2 weeks, self‐reported dizziness, alcohol consumption, education level, physical activity, and smoking status. The plot was truncated at the 0.5th and 99.5th percentiles of postural change in SBP or DBP. In addition, overlaid are kernel density plots depicting the distribution of postural change in SBP or DBP by participants with carotid plaque (red dash) vs those without carotid plaque (solid). Because carotid intimal thickness is a continuous outcome, the kernel density depicts the overall distribution alone (solid).