
Figure 3.
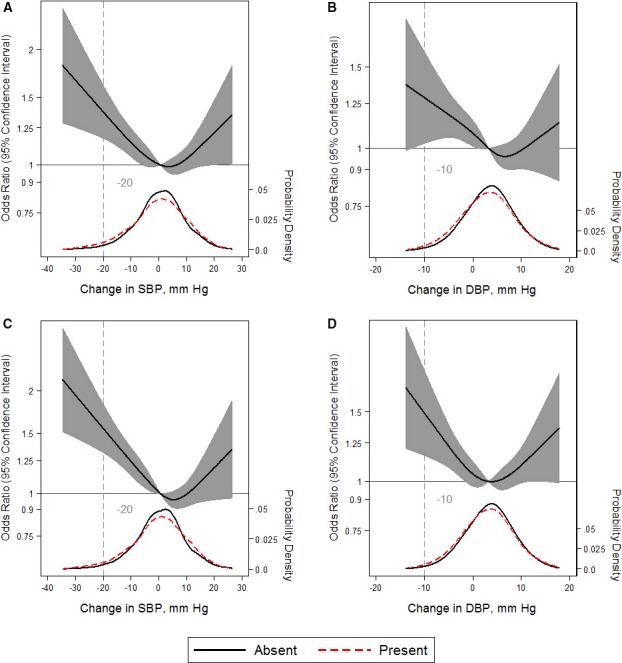
Adjusted restricted cubic splines of the relationship (solid line) between postural change in systolic blood pressure (SBP) or diastolic blood pressure (DBP; per mm Hg) with detectable high‐sensitivity troponin T (hs‐cTNT) ≥5 ng/L (A and B) or elevated NT‐proBNP (N‐terminal pro‐B‐type natriuretic peptide) ≥100 pg/mL (C and D). Gray shade represents 95% confidence intervals. The models were expressed relative to the 50th percentile of postural change in SBP or DBP (0.85 and 3.5 mm Hg, respectively), with 4 knots specified using Harrell's method. All models used logistic regression to determine odds ratios shown on natural log scale and were adjusted for age, sex, race‐center, estimated glomerular filtration rate, body mass index, resting heart rate, high‐density lipoprotein cholesterol, low‐density lipoprotein cholesterol, triglycerides, total cholesterol, diabetes mellitus status, hypertension status, antihypertensive medication use in the past 2 weeks, self‐reported dizziness, alcohol consumption, education level, physical activity, and smoking status. The plot was truncated at the 0.5th and 99.5th percentiles of postural change in SBP or DBP. In addition, overlaid are kernel density plots depicting the distribution of postural change in SBP or DBP by participants with either detectable hs‐cTnT or elevated NT‐proBNP present (red dash) vs absent (solid).