. 2018 May 22;7(11):e008708. doi: 10.1161/JAHA.118.008708
© 2018 The Authors. Published on behalf of the American Heart Association, Inc., by Wiley.
This is an open access article under the terms of the http://creativecommons.org/licenses/by-nc/4.0/ License, which permits use, distribution and reproduction in any medium, provided the original work is properly cited and is not used for commercial purposes.
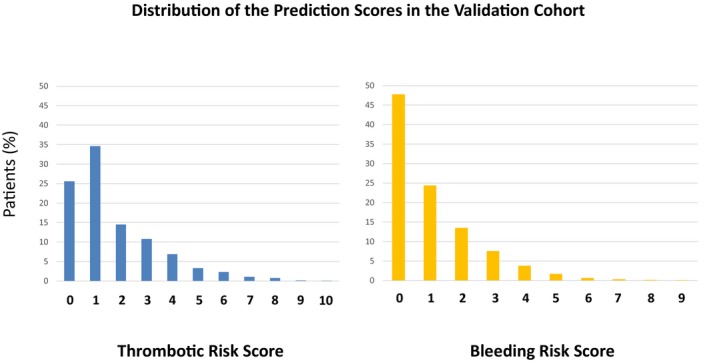
Figure 3.

Distribution of the prediction scores in the validation cohort.
