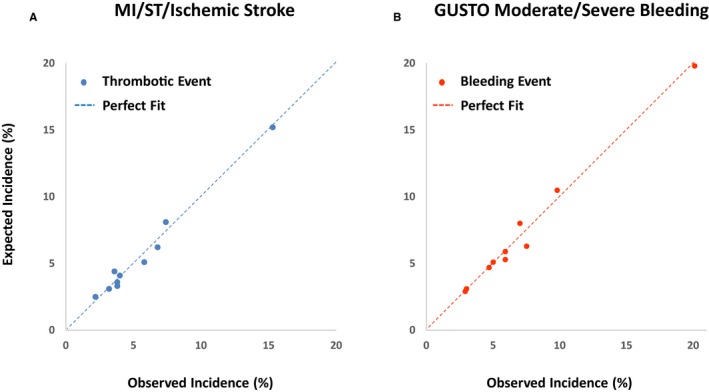
Figure 5.

Observed vs predicted incidence of thrombotic and bleeding events. Scatterplot allowing a visual assessment of the linearity of increasing event rates across risk groups. The straight dashed diagonal line represents perfect calibration, and deviations from this line represent over‐ and underprediction of actual risk. A, MI, ST, and ischemic stroke. B, GUSTO moderate/severe bleeding. GUSTO indicates Global Utilization of Streptokinase and Tissue Plasminogen Activator for Occluded Coronary Arteries; MI, myocardial infarction; ST, definite or probable stent thrombosis.
