Figure 4.

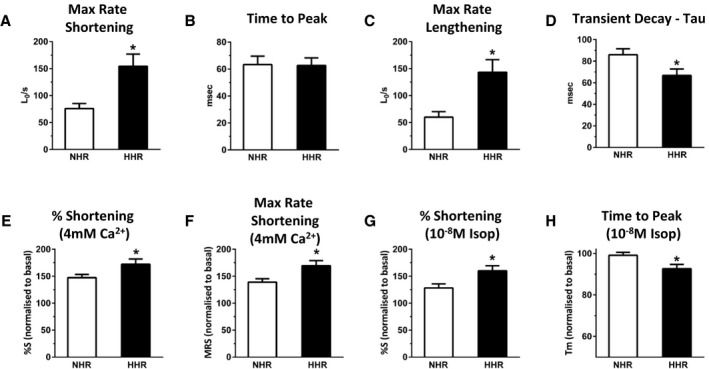
Isolated cardiomyocyte basal shortening parameters and responses to inotropic interventions (20–30 weeks). A through D, Mean maximum rate of shortening, time of peak shortening, maximum rate of lengthening and Ca2+ transient decay time constant (τ=1/e). E and F, Mean changes in shortening (%S) and maximum rate of shortening in response to an increase in superfusate [Ca2+] from 1.5 to 4 mmol/L for normal heart rat (NHR) and hypertrophic heart rat (HHR). G and H, Mean changes in shortening (%S) and time to peak shortening in response to isoproterenol treatment (10−8 mol/L) for NHR and HHR. Graphs show mean ± SEM. For each myocyte group, reference performance level under control pretreatment conditions designated 100%. (*P<0.05, Student t test, n=17 to 19 cells from N=4 to 6 hearts/group).
