
Figure 1.
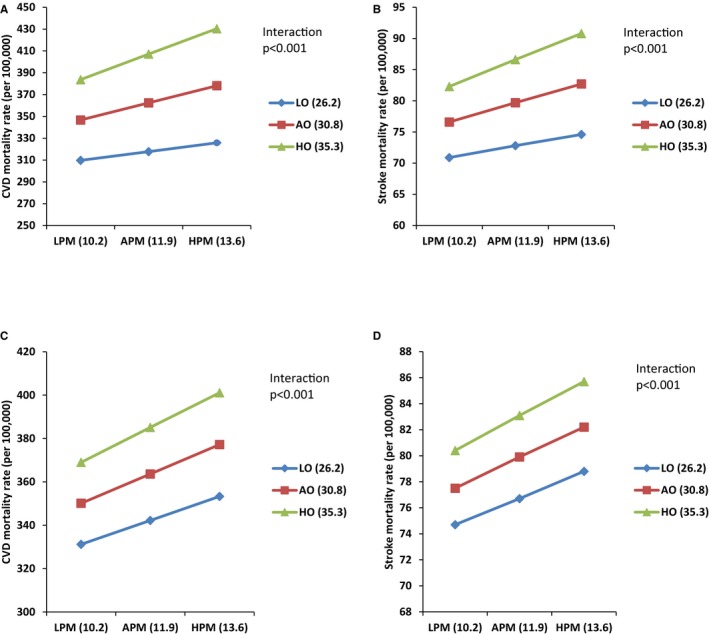
Impact of the variable level of obesity prevalence on the link between particulate matter with diameters <2.5 μm (PM 2.5) and cardiovascular disease (CVD) and stroke mortality in crude and adjusted models. A, Crude model of impact of different level of obesity on the association between CVD mortality and PM 2.5 level (μg/m3). B, Adjusted model (ethnicity, poverty, and education) of impact of different level of obesity on the association between CVD mortality and PM 2.5 level. C, Crude model of impact of different level of obesity on the association between stroke mortality and PM 2.5 level. D, Adjusted model (ethnicity, poverty, and education) of impact of different level of obesity on the association between stroke mortality and PM 2.5 level. AO indicates average obesity; APM, average PM 2.5; HO, high obesity; HPM, high PM 2.5; LO, low obesity; and LPM, low PM 2.5.