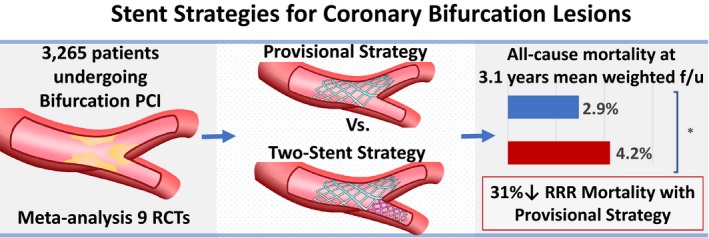
Figure 5.

Central illustration (graphic summary of study). f/u indicates follow‐up; PCI, percutaneous coronary intervention; RCTs, randomized controlled trials; RRR, relative risk ratio. *Denotes P=0.049

Central illustration (graphic summary of study). f/u indicates follow‐up; PCI, percutaneous coronary intervention; RCTs, randomized controlled trials; RRR, relative risk ratio. *Denotes P=0.049