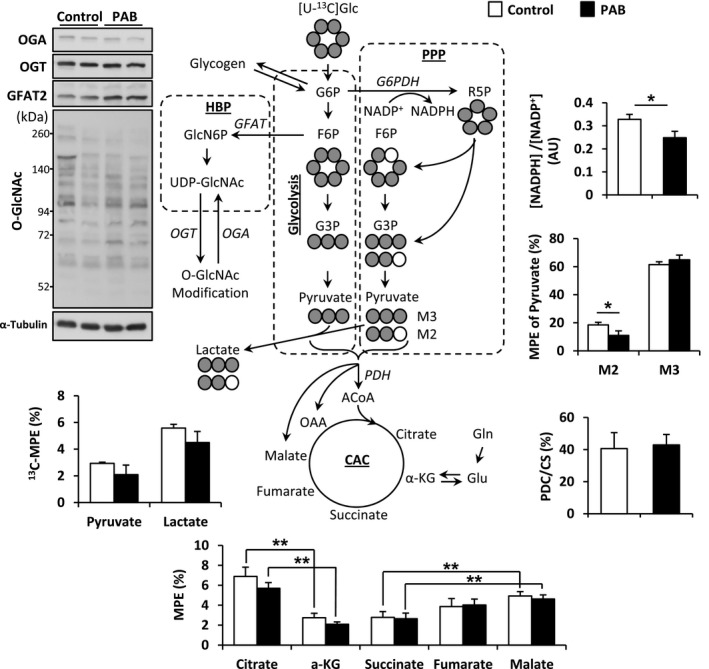
Figure 6.

Schematic demonstrating of [U‐13C]glucose to CAC and PPP, and protein expression levels in HBP. NADPH and M2 pyruvate, produced by PPP, were significantly low in PAB compared with Control. Values are presented as means±SE; n=4 per group. *P<0.05, **P<0.01 vs Control. ACoA indicates acetyl‐CoA; AU, arbitrary units; CAC, citric acid cycle; CS, citrate synthase; GFAT, glutamine‐fructose‐6‐phosphate transaminase; Glc, glucose; Gln, glutamine; Glu, glutamate; HBP, hexosamine biosynthetic pathway; α‐KG, α‐ketoglutarate; MPE, molar percent enrichment; NADP+, the oxidized form of nicotinamide adenine dinucleotide phosphate; NADPH, the reduced form of nicotinamide adenine dinucleotide phosphate; OAA, oxaloacetate; OGA, O‐GlcNAcase; O‐GlcNAc, O‐linked N‐acetylglucosamine; OGT, O‐GlcNAc transferase; PAB, pulmonary artery banding; PDC, pyruvate decarboxylation; PDH, pyruvate dehydrogenase; PPP, pentose phosphate pathway; R5P, ribose‐5‐phosphate.
