
. 2018 May 30;7(11):e008273. doi: 10.1161/JAHA.117.008273
© 2018 The Authors. Published on behalf of the American Heart Association, Inc., by Wiley.
This is an open access article under the terms of the http://creativecommons.org/licenses/by-nc-nd/4.0/ License, which permits use and distribution in any medium, provided the original work is properly cited, the use is non‐commercial and no modifications or adaptations are made.
Figure 1.
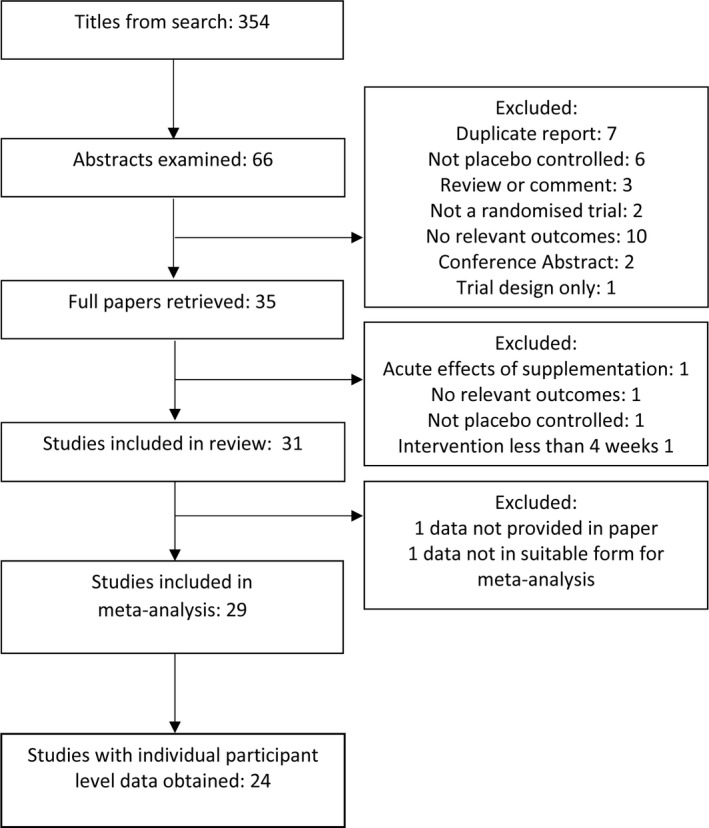
PRISMA diagram showing trial selection.