
Figure 11.
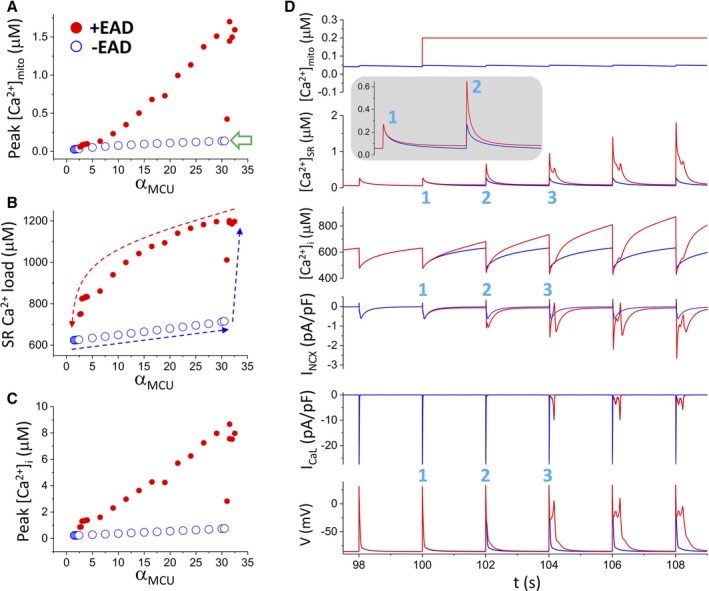
Mechanistic insights from the computer model into the roles of mitochondrial Ca2+ handling in the genesis of early afterdepolarizations (EADs). A through C, Ca2+ concentrations in different compartments of the cell model vs the strength of mitochondrial Ca2+ uniporter (MCU), showing bistability. The simulations were performed as follows. We first started the simulations from the normal control MCU activity (αMCU=1) and increased αMCU gradually to 35, as indicated by the blue arrows (B). The system switches from no EADs (also low Ca2+ concentration states) to EADs (also high Ca2+ concentration states) at αMCU≈30, at which the mitochondrial free Ca2+ reaches 136 nmol/L (open arrow). For each αMCU, 50 beats were simulated for the cell to reach steady state before changing to a larger αMCU. We then started the simulations in the same way but from a high MCU activity (αMCU=35) to the normal control value (αMCU=1), as indicated by the red arrow (B). The system switches from EADs to no EADs at αMCU≈2.4. D. [Ca2+]mito, [Ca2+]i, [Ca2+]SR, INCX, IC a,L, and V vs time from 2 simulations for αMCU=5. In the first simulation (blue traces), the mitochondrial Ca2+ is free running (unclamped), and the cell is in the low Ca2+ state without EADs. In the second simulation (red traces), [Ca2+]mito is suddenly elevated to 200 nmol/L and held constant (clamped) for the rest of the simulation. 1, 2, and 3 mark the first 3 beats during the clamped phase. [Ca2+]mito indicates mitochondrial Ca2+ concentration; [Ca2+]i, intracellular Ca2+ concentration; [Ca2+]SR, SR Ca2+ concentration; INCX, NCX current; IcaL, L‐type Ca2+ current; V, membrane potential.