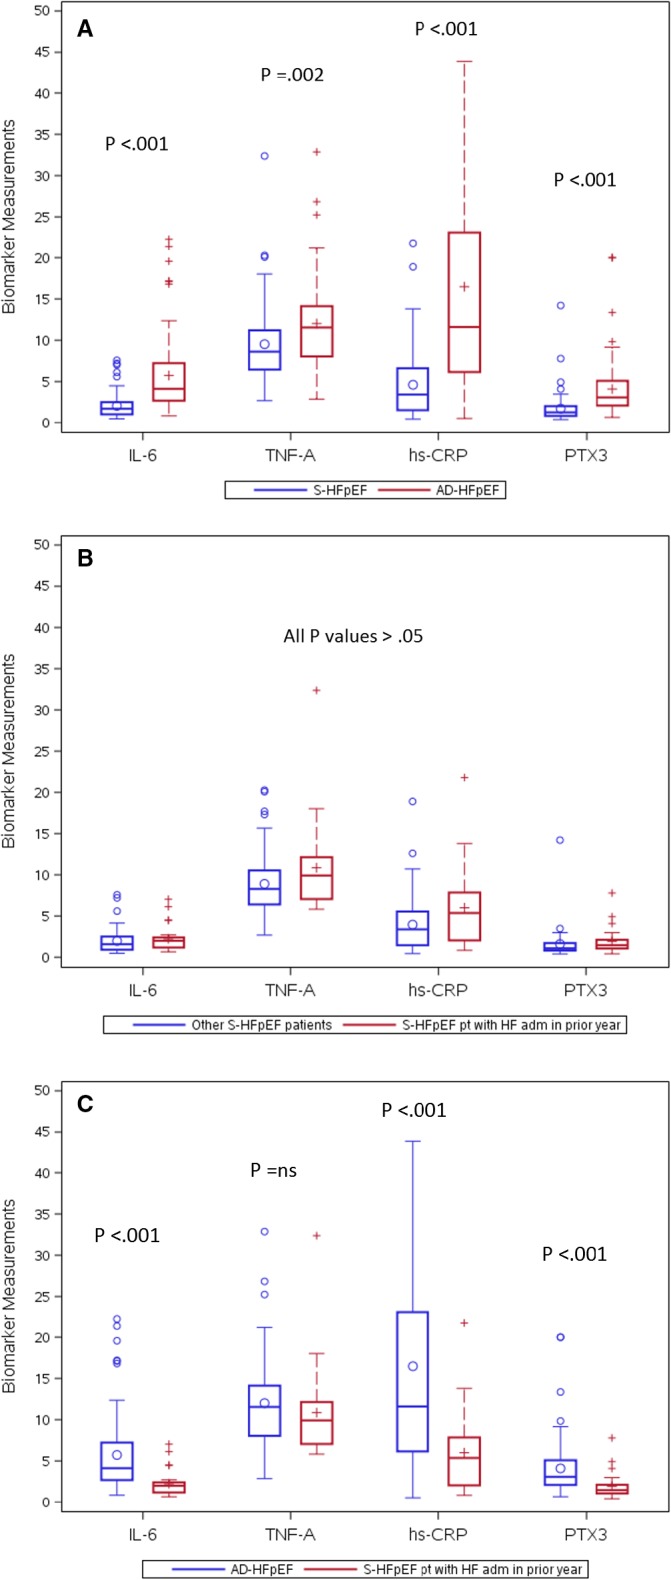
Figure 1.

A, Box and whisker plots of median (solid lines within boxes) and interquartile ranges for pro‐inflammatory biomarkers in S‐HFpEF (RELAX) versus AD‐HFpEF (DOSE and ROSE) patients. Whiskers=ranges from bottom to top 25% of data values, excluding outliers. The latter are shown individually above the whiskers. Small circles and+signs within boxes=mean values. B, Box and whisker plots of pro‐inflammatory biomarkers for S‐HFpEF patients with a HF admission in the prior year versus other S‐HFpEF patients. C, Box and whisker plots of pro‐inflammatory biomarkers for all AD‐HFpEF patients versus S‐HFpEF patients with a HF admission during the prior year. AD‐HFpEF indicates acutely decompensated heart failure with a preserved ejection fraction; DOSE, Diuretic Strategies in Patients With Acute Decompensated Heart Failure; HFpEF, heart failure with a preserved ejection fraction; hs‐CRP indicates high‐sensitivity C‐reactive protein; IL‐6, interleukin 6; PTX3, pentraxin 3; RELAX, Effect of Phosphodiesterase‐5 Inhibition on Exercise Capacity and Clinical Status in Heart Failure with Preserved Ejection Fraction; ROSE, Renal Optimization Strategies Evaluation; TNF‐A, tumor necrosis factor‐α (see text).
