Fig. 5.
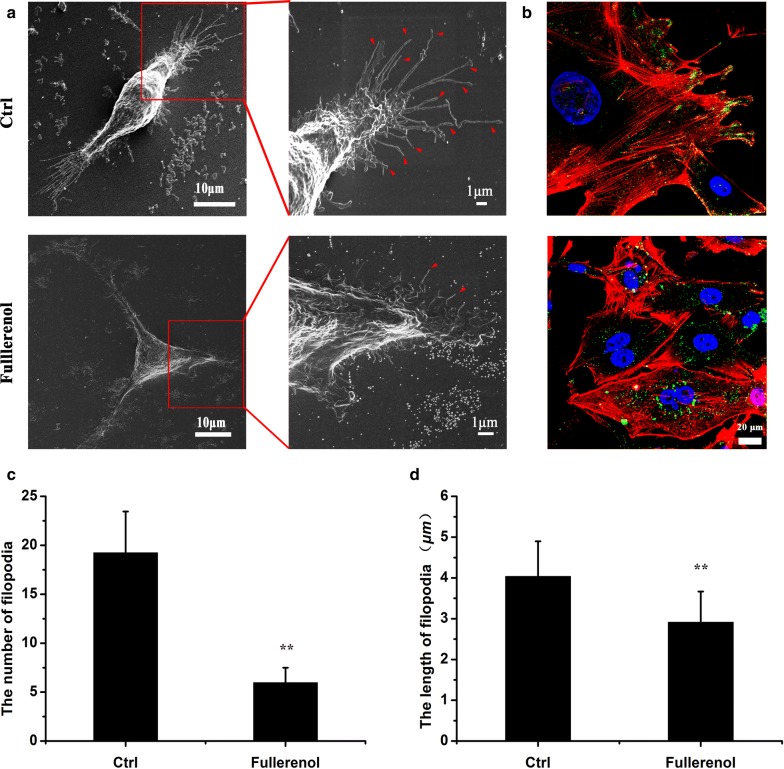
The influence of fullerenol on filopodia formation and integrin distribution. a SEM image of MDA-MB-231 cells. Control cells or those treated with 200 μg/mL fullerenol nanoparticles for 24 h were fixed and dehydrated. Control cells showed numerous spindly protrusions, whereas treated cells displayed short protrusions. b Immunofluorescence images of phalloidin staining in MDA-MB-231 cells. Green = integrin β1, red = actin cytoskeleton, blue = nucleus. Scare bar = 20 μm. c, d A quantification for the number and length of filopodia. n ≥ 50, *P < 0.05, **P < 0.01

