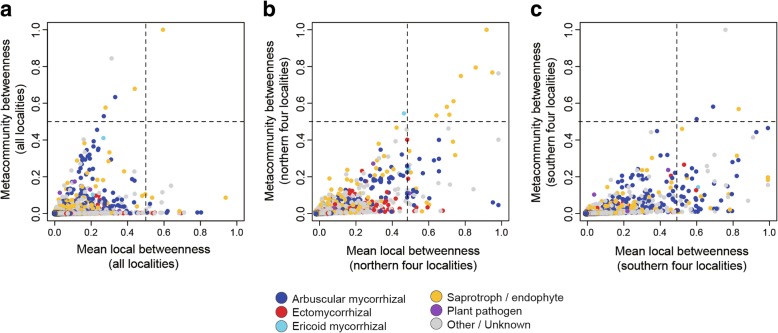
Fig. 5.
Relationship between local- and metacommunity-level betweenness. a Full meatcommunity. On the horizontal axis, the mean values of betweenness centrality scores across all the eight local forests are shown for respective fungal OTUs. On the vertical axis, the betweenness scores within the metacommunity-scale network consisting of the eight localities (Fig. 4) are shown for respective OTUs. b Metacommunity of cool-temperate forests. For the sub-dataset consisting of the four cool-temperate forests (Additional file 9: Figure S4), mean local betweenness and metacommunity betweenness are shown on the horizontal and vertical axes, respectively. c Metacommunity of warm-temperate and subtropical forests. For the sub-dataset consisting of the warm-temperate forest and the three subtropical forests (Additional file 10: Figure S5), mean local betweenness and metacommunity betweenness are shown on the horizontal and vertical axes, respectively

