
Figure 1. Two most prevalent subtypes of human LMs show distinctive cellular compositions.
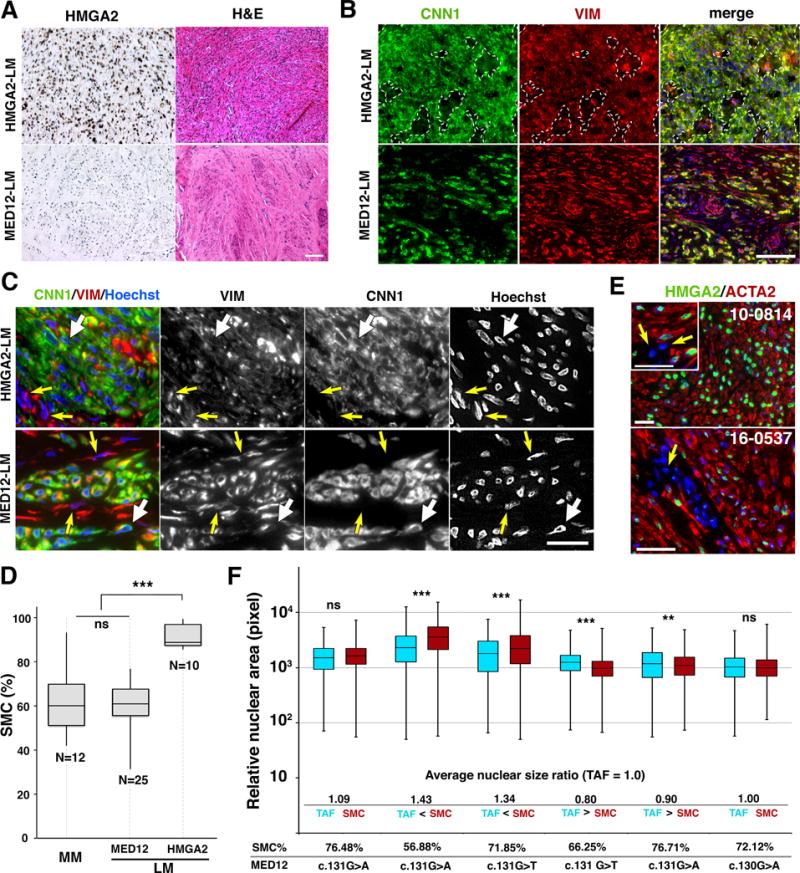
A. Histological characteristics of LM subtypes. Representative images for HMGAs and H&E of HMGA2-LM and MED12-LM subtypes. Bar = 100 μm B. Tissue distribution of SMCs and fibroblasts in HMGA2-LM and MED12-LM tissues. CNN1 (green) stains SMCs, whereas VIM (red) stains both SMCs and fibroblasts. In the HMGA2-LM tissue, perivascular connective tissues devoid of tumor SMCs were marked with dotted lines. In MED12-LMs, fibroblasts are indicated by white arrows. Bar = 100 μm C. Cellular and nuclear appearance of SMCs and tumor associated fibroblasts (TAFs). The nuclei of SMCs (white arrows) and fibroblasts (yellow arrows) are indicated by arrows. Bar = 25 μm. D. Box-plot for the concentration of SMCs in MMs and LMs. The MED12 mutations are listed in Table S1. The statistical significance by ANOVA was indicated as *** p< 0.001 and ns (not significant, P > 0.05). E. HMGA2 is overexpressed in SMCs but not in the nuclei of tumor-associated fibroblasts (arrow). Bar = 50 μm. F. Relative nuclear area of TAFs (blue box) and SMCs (red box) in MED12-LMs. The ratio between average nuclear sizes of SMCs and TAFs (SMC/TFA) is indicated below the boxplot. There was not clear association between nuclear size-ratio, mutation type and SMC concentration. The statistical significance by ANOVA was indicated as *** P< 0.001, ** P< 0.01 and ns (not significant, P > 0.05).