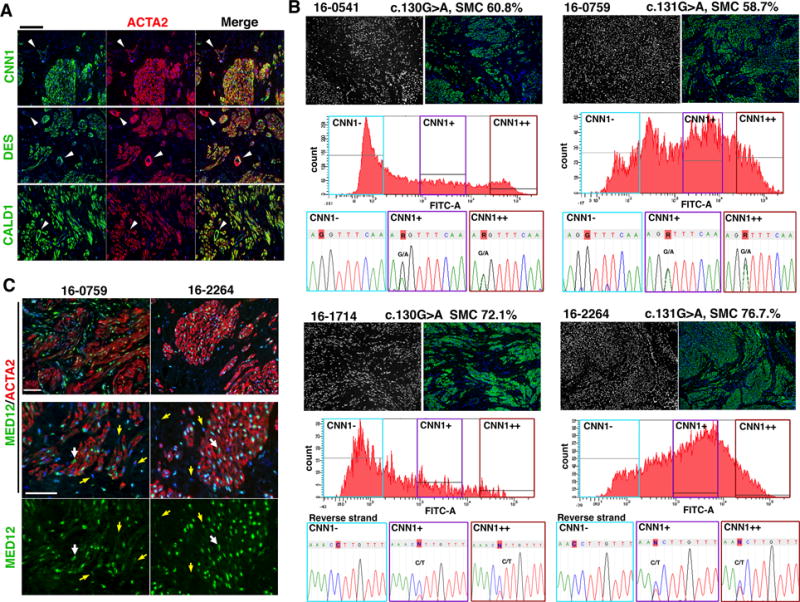
Figure 2. MED12 mutations are present in SMCs but not in TAFs.

A. Expression patterns of SM markers in MED12-LMs. ACTA2, CNN1, DES and CALD1 were uniformly expressed in the SMCs of MED12-LMS. Vascular SMCs (arrowheads) showed significantly lower expression of CNN1 and DES compared to tumor SMCs. B. MED12 mutation analysis of SMC and non-SMC fraction in MED12-LM cases. The case ID number, MED12 missense mutation and SMC concentration by morphometric analysis in the original LM are indicated on top of the panels. IF images demonstrate the distribution of nuclei (black and white) and ATCA2 (green) in the original LM tissues. The FACS charts indicate the distributions of CNN1-signal intensity among isolated cells, and 3 fractions are separated by CNN1 expression level. In all four cases, the missense mutation of the original LM was absent in the CNN1-negative faction, whereas CNN1+ and CNN1++ fractions display peaks for the mutation. The base at the position of point mutation is highlighted with red. C. Expression patterns of MED12 (green) and ACTA2 (red) in MED12-LMs. The nuclei of fibroblasts (yellow arrows) contained lower levels of MED12 compared to that of ACTA2-positive SMCs (white arrows). Bar = 50 μM.
