
Figure 5. Growth control of SMCs and TAFs in MED12-LM.
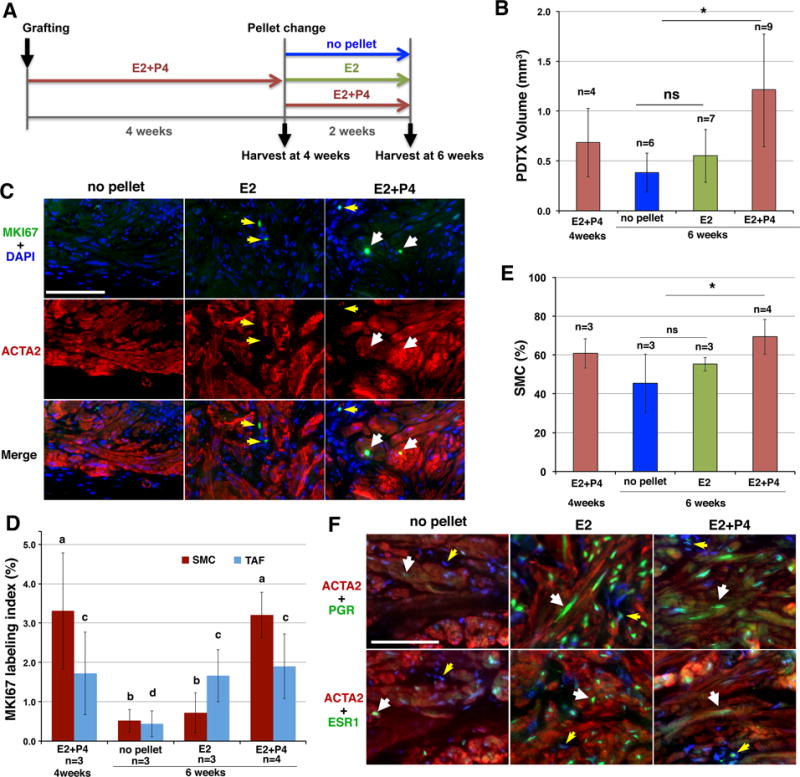
PDTXs were prepared from a MED12-LM (MED12 c.131 G>A). Statistical significance was determined by Analysis of Variance. A. Timeline. PDTXs were grown for 4 weeks with E2+P4, and then subjected to one of three different treatments: no hormone (no pellet), E2 or E2+P4 treatment for 2 weeks, at which point the PDTXs were harvested for analyses. B. The volume of PDTXs. *P < 0.05 and ns (not significant) C. Effect of E2 and P4 on MKI67 expression in SMCs (white arrows) and TAFs (yellow arrows) within MED12-LM PDTXs. D. Proliferation rate (MKI67 labeling index) of SMCs (dark red) and TAFs (light blue). The MKI67 labeling indices were significantly higher in groups marker with “a” than “b” (P < 0.01), and in groups marked with “c” than “d” (P < 0.05). E. Effect of E2 and P4 on SMC concentrations (%) in MED12-LM PDTXs. *P < 0.05. F. Regulation of ESR1 and PGR by E2 and P4 in SMC (white arrows) and TAFs (yellow arrows) in MED12-LMs.