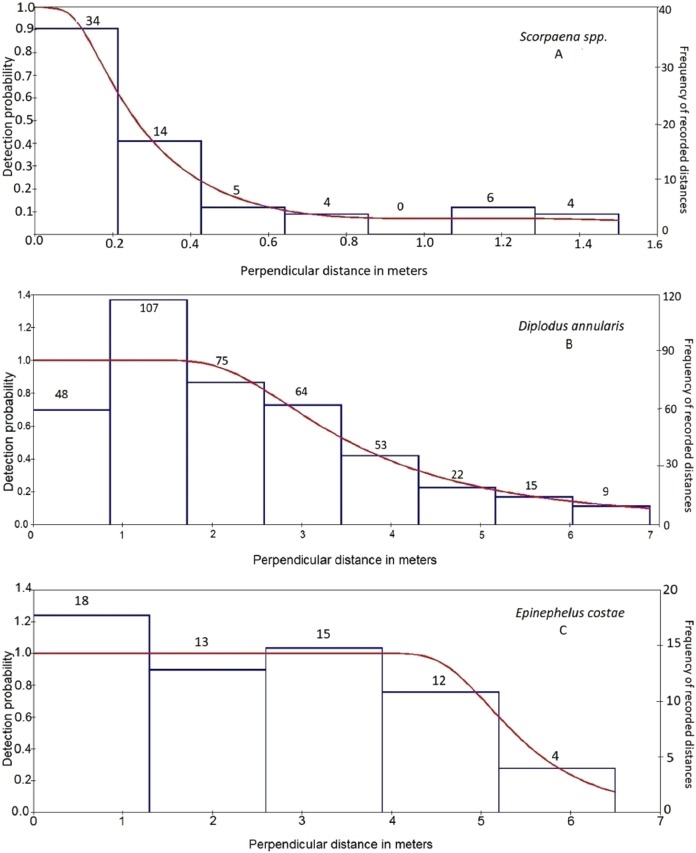
Figure 2. Detection probability curves (lines, left ordinate) estimated for three species recorded in line transects illustrating various fish behaviors.
Detection probability curves (lines, left ordinate) estimated for three species recorded in line transects illustrating (A) secretive behavior (Scorpaena spp.), (B) shy behavior (D. annularis), and (C) neutral behavior (E. costae). Bars (right ordinate) represent the frequency of observations in equal distance classes. The numbers above the bars indicate the number of recorded individuals at each distance class.

