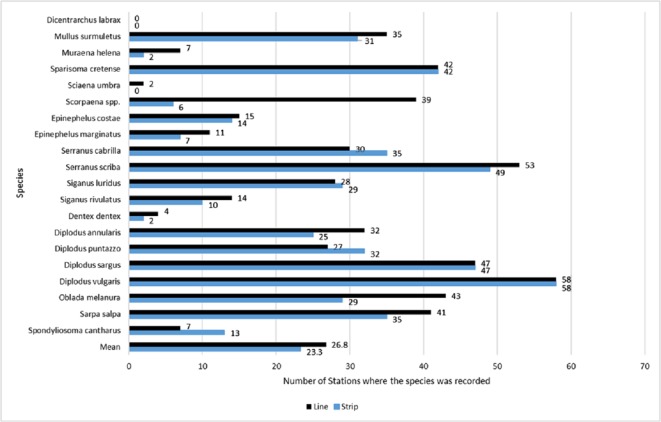
Figure 3. Occupancy estimates per species and per method, expressed as the total number of stations in which the species was present.
Occupancy estimates per species and per method, expressed as the total number of stations in which the species was present (numbers next to the bars), based on surveys by the line (black color/top bar) and strip (blue color/bottom bar) transects methods. The last two bars indicate the mean estimated occupancy of all species per method. The total number of stations was 61.

