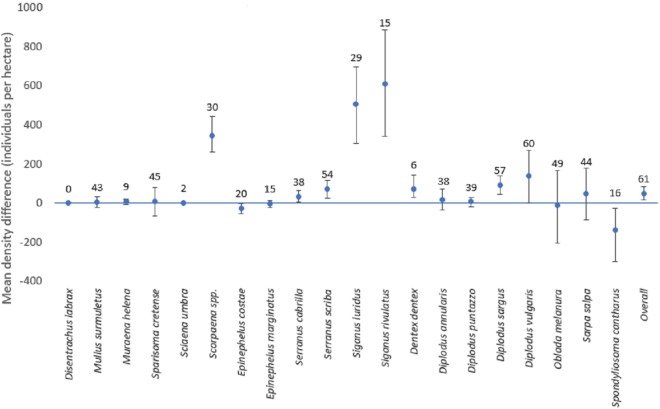
Figure 5. Mean differences of density estimates for each species (with confidence intervals).
Mean differences of density estimates for each species. The bars depict the 95% confidence intervals. The numbers above each point represent the sample size (i.e., the number of stations where the species was present with any of the two methods, when the overall sample size is 61 stations).

