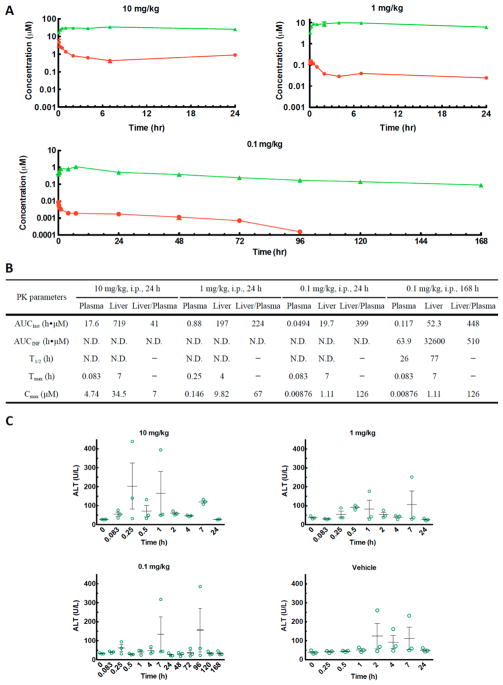
Figure 4.
Pharmacokinetics studies of compound 7ii in the mouse model. (A) Mean liver (green triangle) and plasma (red dot) concentration–time profiles of compound 7ii after administration of a single i.p. dose at 10, 1, and 0.1 mg/kg at indicated time points. Compound concentration of 7ii was measured by UPLC-MS/MS methods and is shown in means ± SEM (n = 3 per time point). (B) Pharmacokinetic parameters of compound 7ii. AUClast = AUC0–24h or AUC0–168h depending on the sample collection interval. N.D., not determined. (C) ALT levels of the mouse serum samples collected during the pharmacokinetics study. Results for each mouse are shown with scatter plots, and error bars show means ± SEM.

