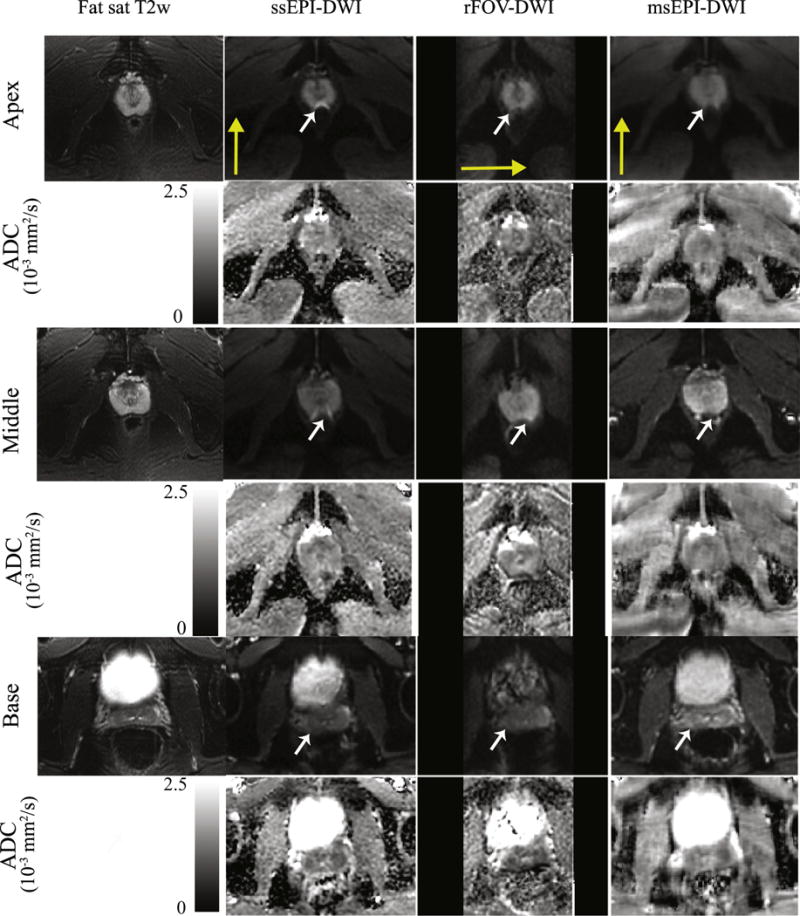
Figure 3.

Representative diffusion-weighted images and ADC maps across three sequences of a healthy volunteer. Three different slices from the apex, middle and base plane of the prostate respectively are shown with corresponding T2-weighted FSE images for illustration of the distortion. White arrows indicate an area with distortions in ssEPI images. Yellow arrows for each sequence represent the phase encoding direction.
