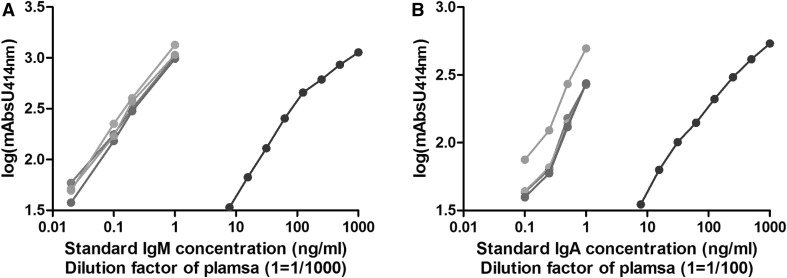
Fig. 2.
Parallelism of the curves for total IgM (a) and IgA (b) obtained with the isotype standard (dark blue) and diluted plasma from experimental rats immunized with GM maize (green), conventional maize (purple), Cry1Ab protoxin (clear blue) or kept naïve (red). The x-axis represents the concentration of the isotype standard or the dilution factor of the different plasma samples (a dilution factor of 1 corresponds to an initial dilution factor of 1/1000 for IgM and 1/100 for IgA). mAbs414nm, absorbance unit at 414 nm. (Color figure online)

