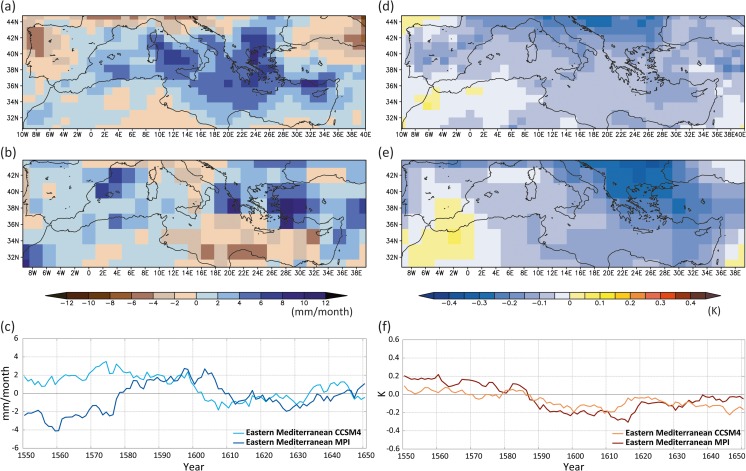
Fig. 10.
Simulated extended winter precipitation (left panel, in mm/month) and temperature (right panel, in K) anomalies in the Mediterranean during the period 1580–1610 CE: (a, d) CCSM4, (b, e) MPI-ESM-P, (c, f) Temporal evolution of simulated precipitation and temperature anomalies over the Eastern Mediterranean (20–40° E, 30–45° N). The anomalies are calculated with respect to the reference period 1651–1850 CE

