
Figure 2.
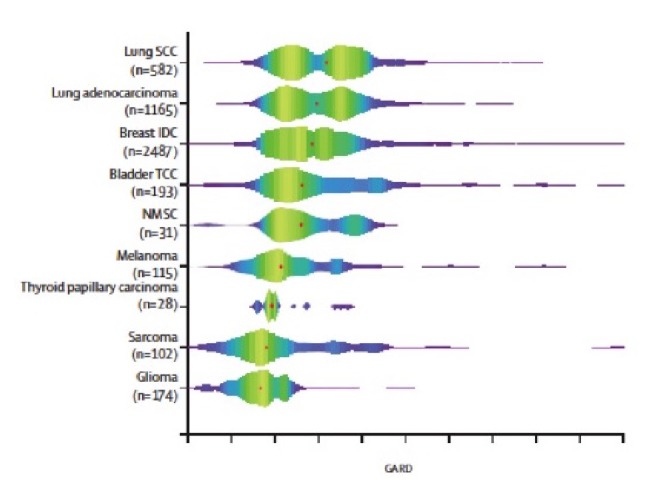
GARD score distribution and density within 60 Gy dose level, by disease site. The red dot represents the median GARD value for each disease site at assigned dose levels. Colors in the plot correlate with the sample density. GARD=genomic adjusted radiation dose. IDC=invasive ductal carcinoma. TCC=transitional cell carcinoma. NMSC=nonmelanoma skin cancer. Reprinted from The Lancet Oncology, Vol. 18, Scott JG, Berglund A, Schell MJ et al., A genome-based model for adjusting radiotherapy dose (GARD): a retrospective, cohort-based study, 202-211, 2017, with permission from Elsevier.