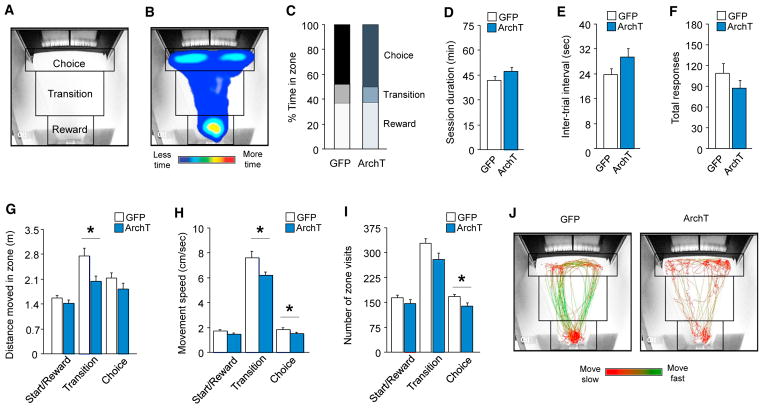
Figure 2. Effects of DLS Photosilencing Effects on Spatiotemporal Parameters in the Touchscreen Task.
(A) Definitions of choice, transition, and reward zones.
(B) Representative heatmap of cumulative time spent in each zone.
(C) Percentage distribution of time in each zone did not differ between GFP and ArchT groups.
(D) Average time to session completion did not differ between GFP and ArchT groups.
(E) Average inter-trial interval did not differ between GFP and ArchT groups.
(F) Total responses made did not differ between GFP and ArchT groups.
(G) The ArchT group traveled less distance in the transition zone than GFP controls (t[14] = 2.81, p < 0.05).
(H) The ArchT group moved more slowly in the transition (t[14] = 2.30, p < 0.05) and choice (t[14] = 2.18, p < 0.05) zones than GFP controls.
(I) The ArchT group visited the choice zone less frequently than GFP controls (t[14] = 2.38, p < 0.05).
(J) Representative movement speed traces in GFP and ArchT groups (maximum green = 7.5 cm/s, maximum red = 1.5 cm/s).
*p < 0.05. Data are mean ± SEM.

