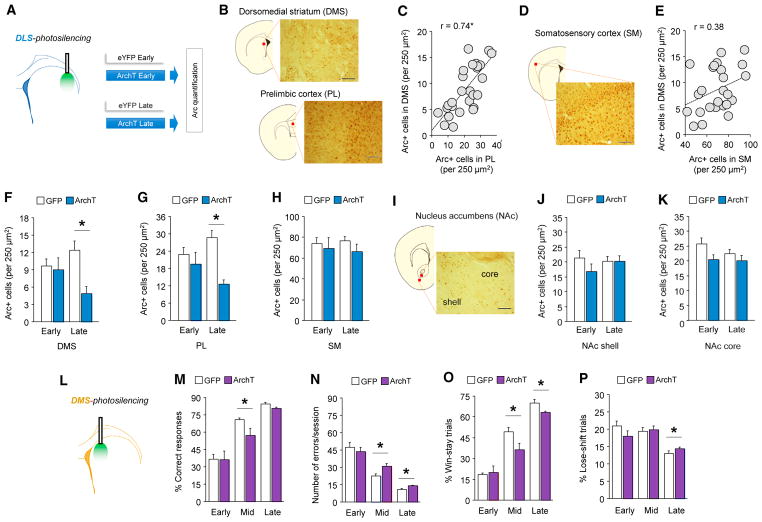
Figure 4. System-Level Adaptations to DLS Photosilencing.
(A) Effects of DLS photosilencing on number of Arc+ neurons in various brain regions was quantified after early or late learning.
(B–E) Irrespective of DLS photosilencing or learning stage, Arc+ neuronal number was highly correlated between DMS and PL (B and C), but not DMS and SM
(D and E) (data from n = 5–9 mice, n = 6 sections per mouse, n = 650–790 DMS cells, n = 1,600–1,772 PL cells).
(F–P) DLS photosilencing decreased late-learning Arc expression in DMS (F) (t[11] = 3.76, p < 0.01, n = 59) and PL (G) (t[11] = 5.88, p < 0.01), not SM or NAc (H–K). DLS-photosilencing decreased late-learning Arc expression in DMS (F, t(11) = 3.76, p < 0.01, n = 5–9) and PL t(11) = 5.88, p < 0.01) (G), not SM (H), NAc shell or NAc core (I–K) DMS-photosilencing (L) impaired mid/late-learning on multiple measures (M, % correct mid = t(13) = 2.22, p < 0.05; N, errors mid = t(13) = 2.43, p < 0.05, late = t(13) = 2.56, p < 0.05; O, % win-stay trials mid = t(13) = 2.30, p < 0.05, late = t(13) = 2.13, p = .05; n = 7–8) and increased late-stage lose-shift behavior (t(14) = 2.58, p < 0.05) (P).
*p < 0.05. Data are mean ± SEM. Scale bar = 50 μm.

