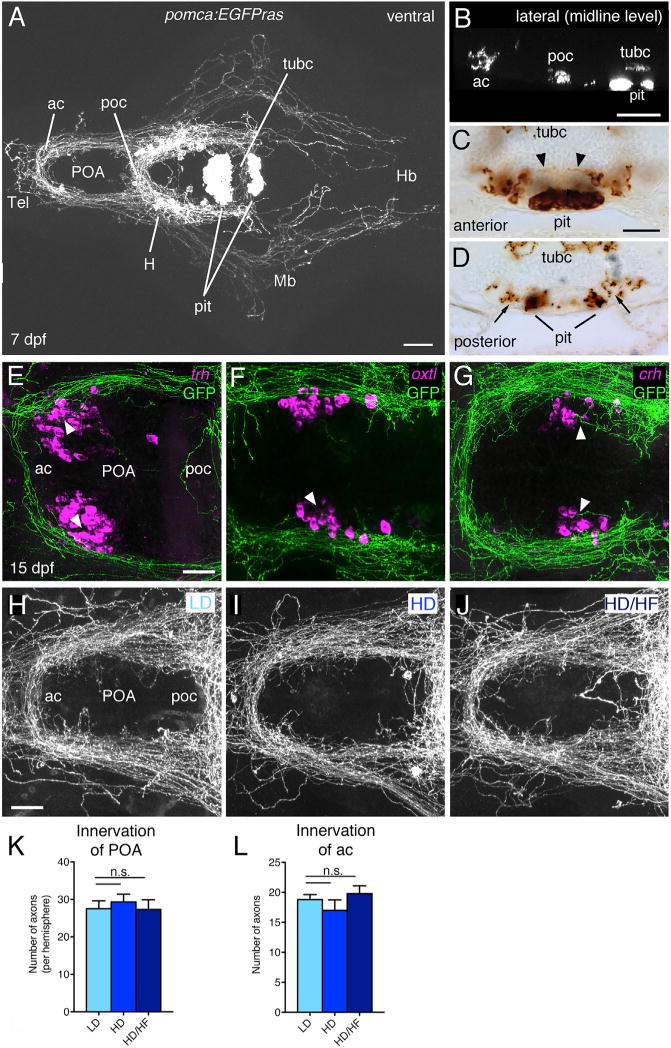
Figure 3. Analysis of Pomca Circuitry Reveals Sparse Pituitary Innervation by Pomca Axons and Unaltered POA Innervation after Excessive Feeding.

(A–D) Anti-GFP IF (A and B) or immunohistochemistry (IHC) (C and D) on transgenic pomca:EGFPras larvae at 7 dpf.
(A) Cell bodies and projections of Pomca neurons in the hypothalamus (H) and pomca+ pituicytes (pit) in the adenohypophysis are labeled. Pomca neurons project to telencephalon (Tel), preoptic area (POA), midbrain (Mb), and hindbrain (Hb).
(B) Optical sagittal section at the level of the midline depicting Pomca axons crossing the anterior (ac), postoptic (poc), and the posterior tuberculum commissure (tubc) dorsal to the pituitary.
(C and D) Cross sections at anterior (C) and posterior (D) levels of the pituitary; Pomca axons are dorsal (arrowheads; entering neurohypophysis) or lateral (arrows) of the Pomca pituicytes of the adenohypophysis (pit).
(E–G) Fluorescent in situ hybridization (ISH) for trh (E), oxt (F), and crh (G) neurons in the POA (arrowheads) combined with anti-GFP IF in pomca:EGFPras larvae at 15 dpf.
(H–L) Unaltered POA innervation in pomca:EGFPras larvae subjected to LD (H), HD (I), or HD/HF (J) treatments, revealed by anti-GFP IF and subsequent quantification of axon number in the POA (K; n = 5) or anterior commissure (ac; L; n = 5).
Scale bars represent 100 μm (A and B), 50 μm (C and D), and 25 μm (E–J); n.s., not significant. Error bars in (K) and (L) show SD.
