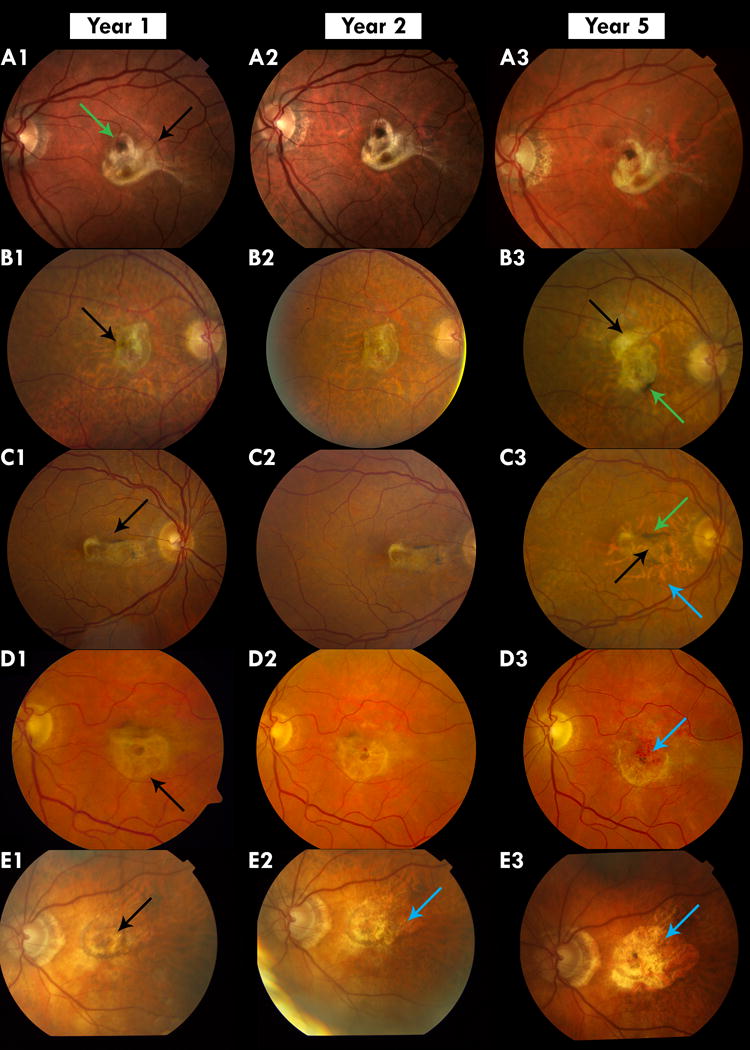
Figure 1.

Color images of fibrotic scar and macular atrophy associated with fibrotic scar (atrophy)
A: Stable Fibrotic Scar: A1 shows a fibrotic scar that has developed at year 1 (black arrow). It remains stable at Year 2 and 5. There is hyperpigmentation on the scar (Green arrow)
B Scar increasing in size: B1 shows a fibrotic scar that shows no change in area from Year 1 (B1) to year 2 (B2) but has a larger area in year 5 (B3) when there is growth superiorly (black arrow). There is also pigmentation on the scar (Green arrow) at year 5
C Scar with Peripheral Macular Atrophy: C1 shows a fibrotic scar at year 1 that undergoes thinning at year 2 (B3 Black arrow) with an area of macular atrophy associated with fibrotic scar (atrophy) surrounding it in year 5 (B3 Green arrow). Increased hyperpigmentation is also seen at year 5 (B3 Blue arrow).
D Macular Atrophy Associated with Fibrotic scar: D1 shows a thick round fibrotic scar at year 1 (Black arrow). In year 5 the superior part of the fibrotic scar has been replaced by macular atrophy (D3 Blue arrow)
E. Scar completely replaced by macular atrophy: E1 shows a fibrotic scar (Black arrow) that develops atrophy in year 2 (E2 Blue arrow) and eventually at year 5 the area of the fibrotic scar is replaced by an expanding macular atrophy (E3 Blue arrow).
