
Figure 1. Gas vesicles (GVs) produce susceptibility-based MRI contrast.
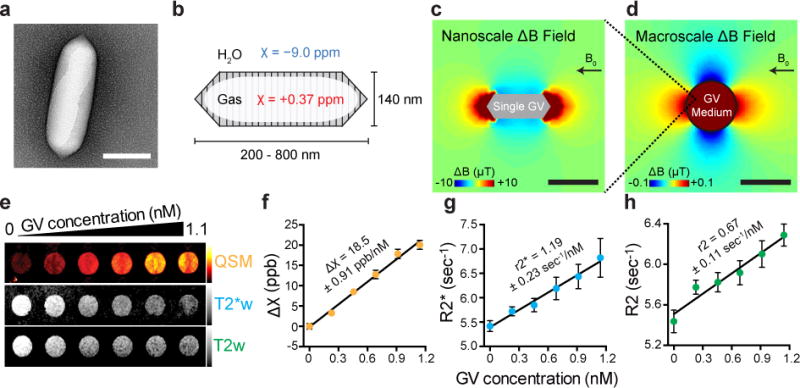
a, Transmission electron microscopy (TEM) image of a GV from Anabaena flos-aquae (Ana) b, Schematic drawing of a GV, whose air-filled interior has magnetic susceptibility (red) different from that of surrounding H2O (blue). c, Finite element model of the magnetic field gradient produced by a single air-filled Ana GV in water exposed to a 7 Tesla horizontal magnetic field (B0). d, Finite element model of the magnetic field gradient produced by a cylindrical sample of 1 nM Ana GVs embedded in an agarose phantom. e, Quantitative susceptibility map (QSM), T2*-weighted (T2*w) and T2-weighted (T2w) images of wells containing Ana GVs at concentrations ranging from 0 to 1.1 nM. The color schemes for QSM (red hot), T2*w (grey) and T2w (grey) images are used across all figures. The QSM color scale ranges linearly from −2 to +50 parts per billion (ppb), and T2*w and T2w images at echo time (TE) = 144 msec have linear scales adjusted for optimal contrast. f, g, h, Magnetic susceptibility, T2* relaxation rate and T2 relaxation rate, respectively for different concentrations of Ana GVs. The value and the standard error of the slope from the linear regression fitting are shown for each plot and corresponds to molar susceptibility (f), r2* relaxivity (g) and r2 relaxivity (h). N = 9 independent samples in (f, g) and N = 6 independent samples in (h). Error bars represent SEM. Scale bars represent 150 nm (a), 300 nm (c) and 3 mm (d).