
Figure 2. Background-free acoustically modulated imaging.
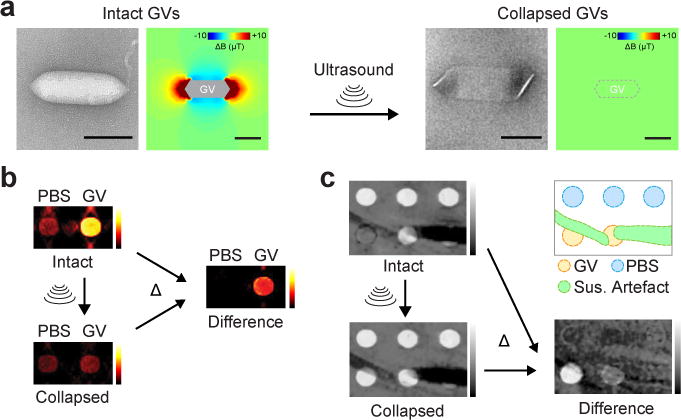
a, TEM images and simulated magnetic field profiles generated by intact and collapsed Mega GVs. Scale bars represent 100 nm. b, Magnetic susceptibility maps of wells containing phosphate-buffered saline (PBS) or 4.9 nM Mega GVs before and after the application of ultrasound, and the resulting difference image. c, T2*-weighted images of a phantom containing wells with 8.1 and 4.9 nM Mega GVs alongside background hyperintense contrast from wells with PBS in low-percentage agarose and hypointense susceptibility artefact from the nearby 40 μm (inner diameter) capillary tubes containing 500 mM NiSO4, before and after the application of ultrasound, and the resulting difference image. The diagram outlines the different regions of the phantom.