
Figure 3. Background-free imaging of GVs in mammalian tissues.
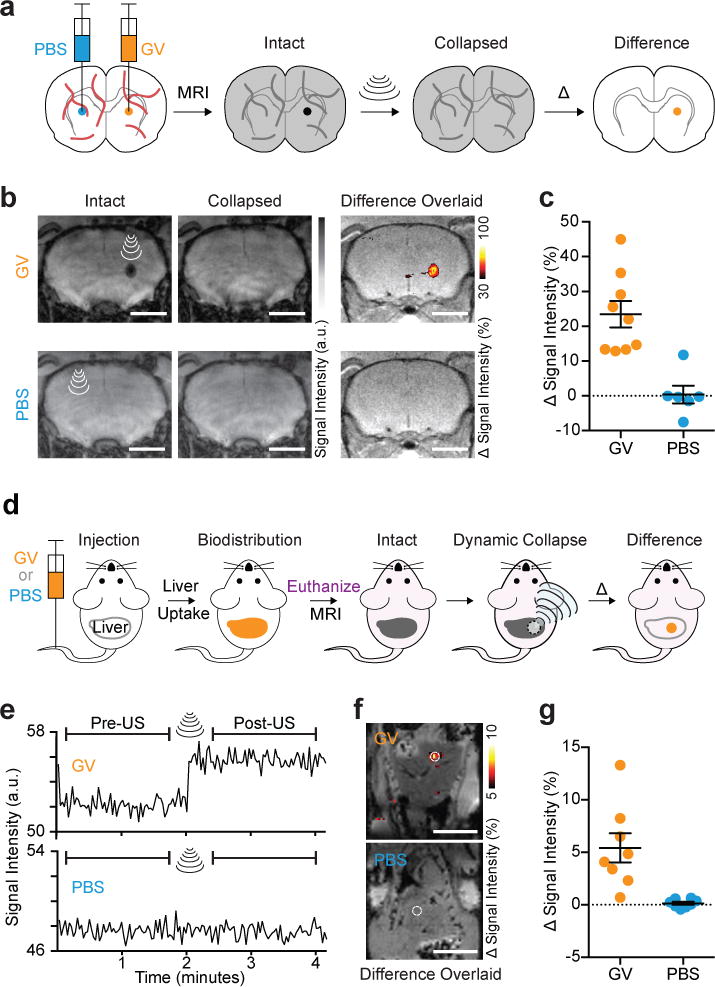
a, Diagram of the in vivo experiment in the living mouse brain. GVs or PBS buffer (sham control) were injected into contralateral striatum. T2*-weighted images taken before the insonation were subtracted from those taken after, and difference images were calculated to reveal contrast specific to the GVs, giving rise to a background-free image. b, Representative T2*-weighted images (TE = 15 msec) of a mouse injected with 2 μL GVs (AnaWT, 3.4 nM) or PBS, acquired before and after ultrasound was applied to the site of injection. The resulting difference images are overlaid on anatomical images. c, Changes in signal intensity upon insonation at the sites of injection (N = 9 and 6 injections for GV and PBS, respectively, in a total of 8 mice) normalized by the intensity of the surrounding brain region. d, Diagram of dynamic imaging of the mouse liver after intravenous administration of GVs. 200 μL PBS with or without 13.7 nM GVs (AnaΔC, clustered form) were injected. After allowing 1 min for the biodistribution of GVs to the liver, mice were euthanized, and T2*-weighted images (1.9 sec/frame) were acquired continuously before, during and after a 5-second application of ultrasound pulses to a spot in the liver. e, Representative time course of signal intensity at an insonated spot (1 mm radius) of mouse liver after intravenous injection with GVs or PBS. f, Difference in intensity between images acquired before and after ultrasound application, overlaid on anatomical images. g, Average signal intensity change in the insonated region upon the application of focused ultrasound to the liver tissue (N = 8 spots for each condition in a total of 8 mice). a.u. denotes arbitrary units. Error bars represent SEM, and scale bars represent 3 mm (b) and 10 mm (e).