
Figure 4. Acoustically modulated reporter gene imaging in living cells.
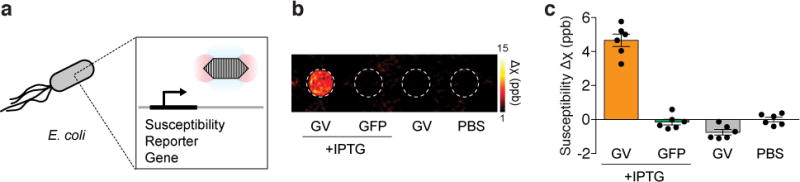
a, Diagram of the inducible expression of GV genes in E. coli leading to the intracellular formation of GVs and the generation of susceptibility-based MRI contrast. b. Representative background-subtracted QSM image of agarose phantom containing E. coli expressing GVs or a green fluorescent protein (GFP) under the control of an IPTG-inducible promoter, in the presence or absence of the inducer, compared to a well containing buffer. c. Mean differential susceptibility values relative to buffer. N = 6 biological replicates. Error bars represent SEM. All bacterial cells were loaded in the phantom at a final OD600 of 8.0.