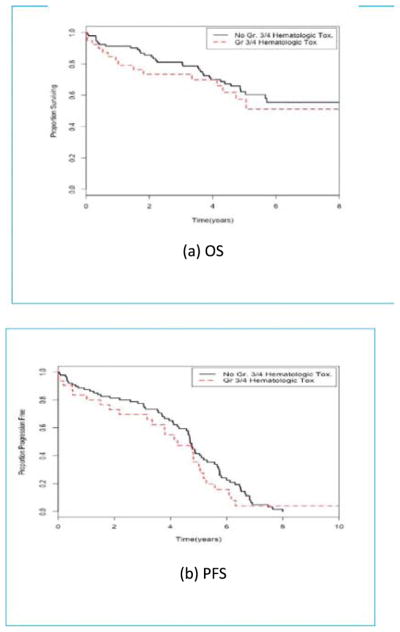
Fig. 1.
Kaplan-Meier curves for older (≥65) NHL patients by grade three or four hematologic toxicity status. (A) OS in NHL patients who did not experience a grade three or four hematologic toxicity at or before landmark time (black line) and patients who did experience such a toxicity (red line). (B) PFS in NHL patients who did not experience a grade three or four hematologic toxicity at or before landmark time (black line) and patients who did experience such a toxicity (red line). (For interpretation of the references to color in this figure legend, the reader is referred to the web version of this article.)

