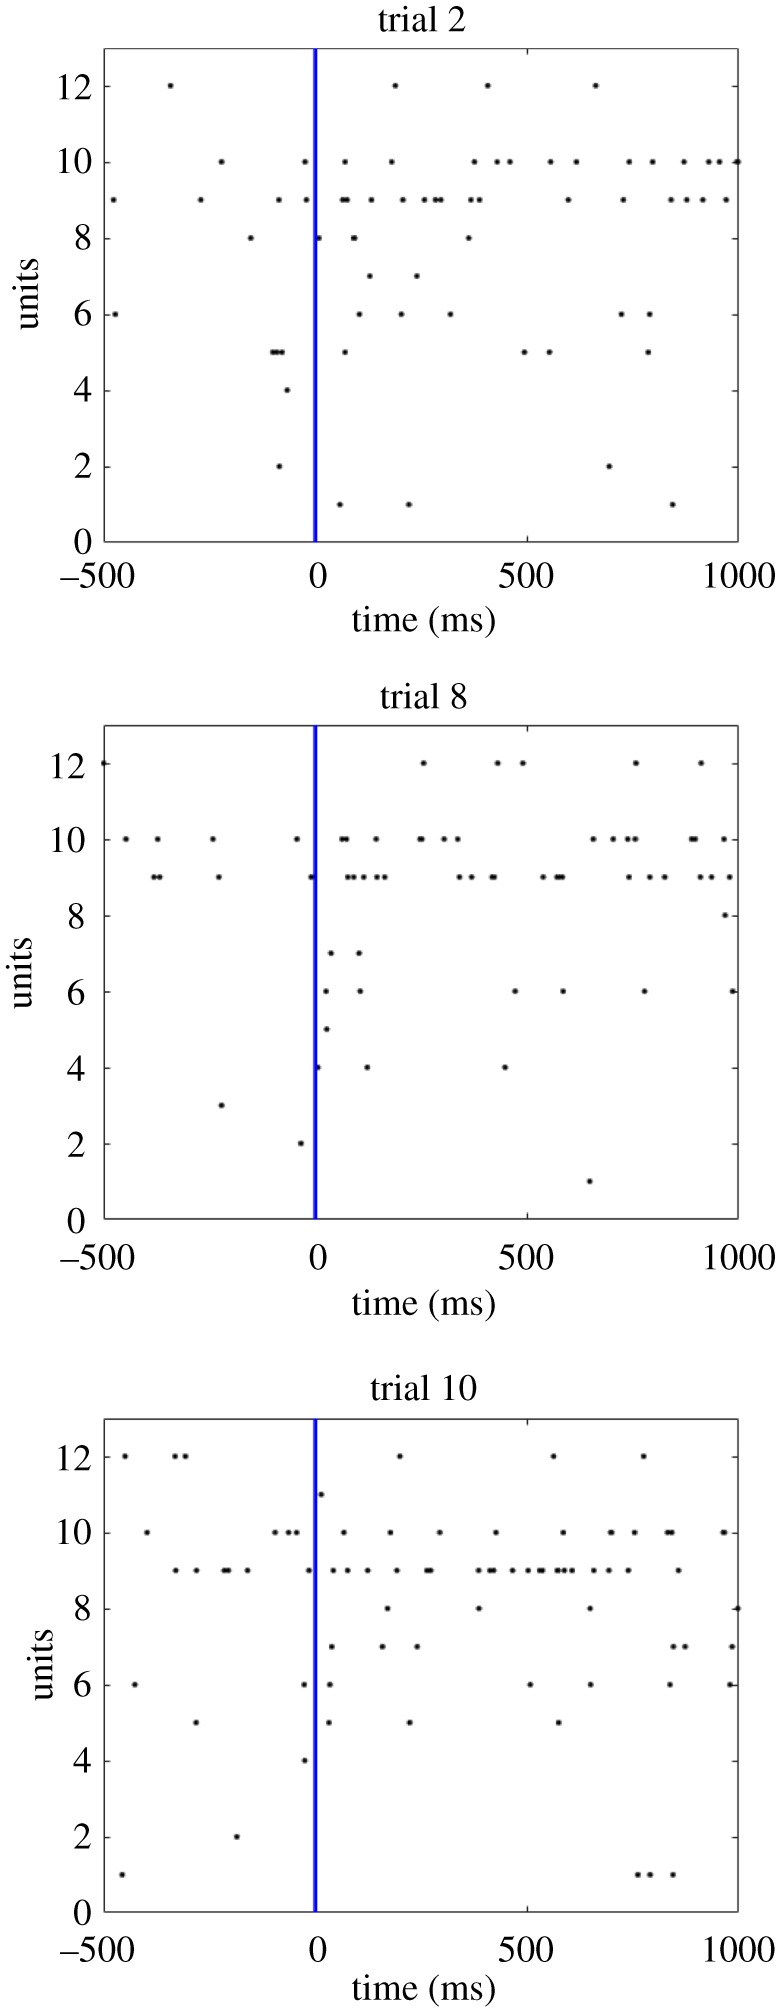
Figure 5.

Neurophysiological evidence from single unit recording carried out in monkey prefrontal cortex (PFC) using chronically implanted multi-electrode arrays. This figure presents three spike raster plots recorded from the PFC of an awake behaving monkey as the animal looked at a visual stimulus. That is, each row shows the series of spikes emitted by a different individual unit through 1000 ms as the monkey viewed the stimulus. It can be seen that each spike raster plot shows fluctuations in the local spike density through time, with some localized clusters of spikes. We hypothesize that these localized variations in spike density reflect underlying polychronous activity within this brain region and other reciprocally connected areas. (Online version in colour.)
