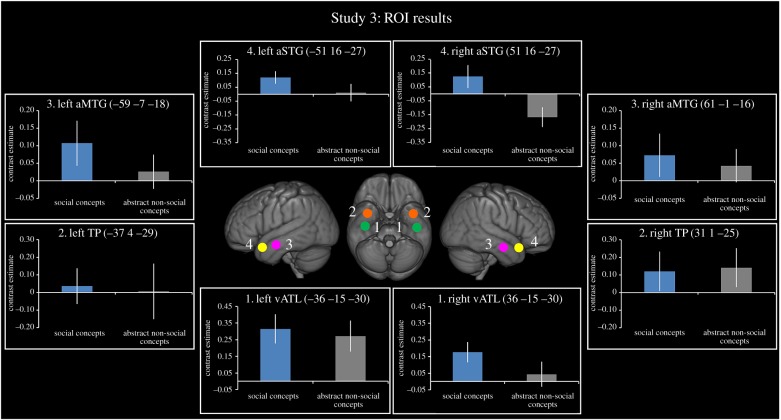
Figure 5.
ROI analysis results for Study 3. Results are shown for four ROIs derived from the literature. Blue bars represent the social conditions and grey bars represent the non-social condition. All bars show the relative activation for each condition of interest compared to its matched non-semantic control condition. Error bars show standard error.

