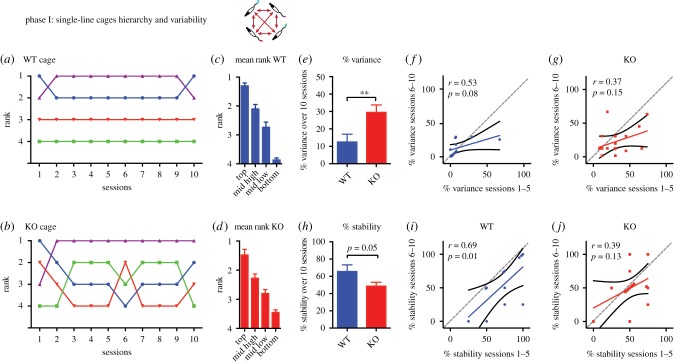
Figure 2.
Cage hierarchies—single-line cages. (a,b) Representative session rankings of individual colour tail-marked rats in a single-line WT cage (blue) and a single-line KO cage (red) across 10 days of testing. Note greater instability of rank of the KO rats. (c,d) Mean rank of rats as a function of their ordinal position in a cage hierarchy averaged across 10 days. Note clear hierarchy of WT single line (three cages) and KO single line (four cages). (e–g) Normalized percentage variance of rank for WT and KO rats across 10 sessions of testing, and correlation between variance observed during sessions 1–5 and 6–10 for WT and KO rats respectively. (h–j) Normalized percentage stability for WT and KO rats across the same sessions as (e–g). **p < 0.01; mean ± 1 s.e.m.

