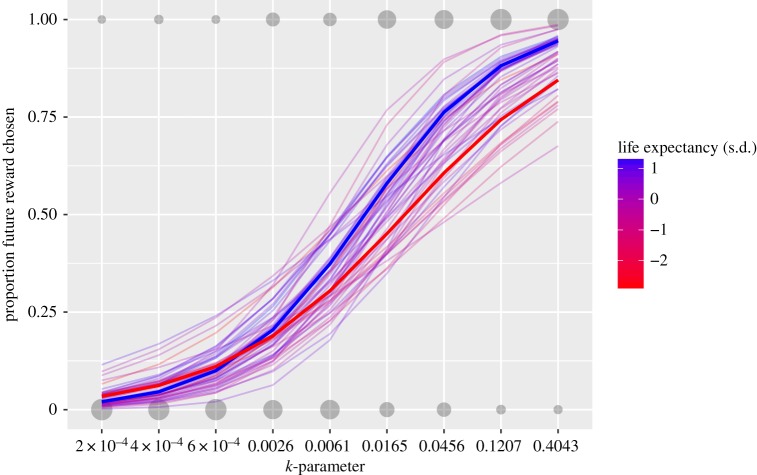
Figure 1.
Proportion of times the future reward is chosen over the immediate reward across multiple trials with varying k-parameter. The size of the circles represents number of times the future (top) or immediate (bottom) reward was chosen for each trial. Thick lines represent the binomial linear regression from countries above (blue) and below (red) the mean on life expectancy (across year and participants). Thin lines represent the binomial linear model for each country.

