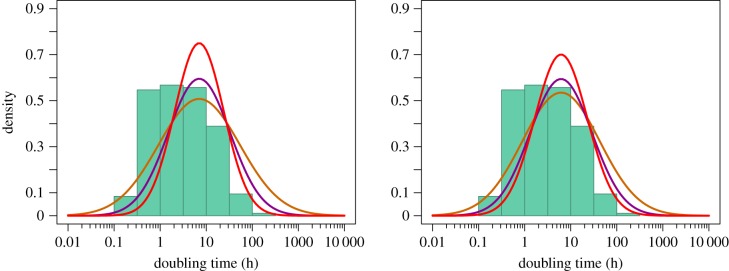
Figure 2.
The distribution of DTs among bacteria inferred assuming different levels of correlation between the accumulation and mutation rates—orange r = 0, purple r = 0.5 and red r = 0.75. We also show the distribution of laboratory DTs (green histogram) from a compilation of over 200 species made by Vieira-Silva & Rocha [32]. In (a) we include all mutation rate estimates and in (b) we exclude the mutation rate estimate for Mesoplasma florum. (Online version in colour.)

