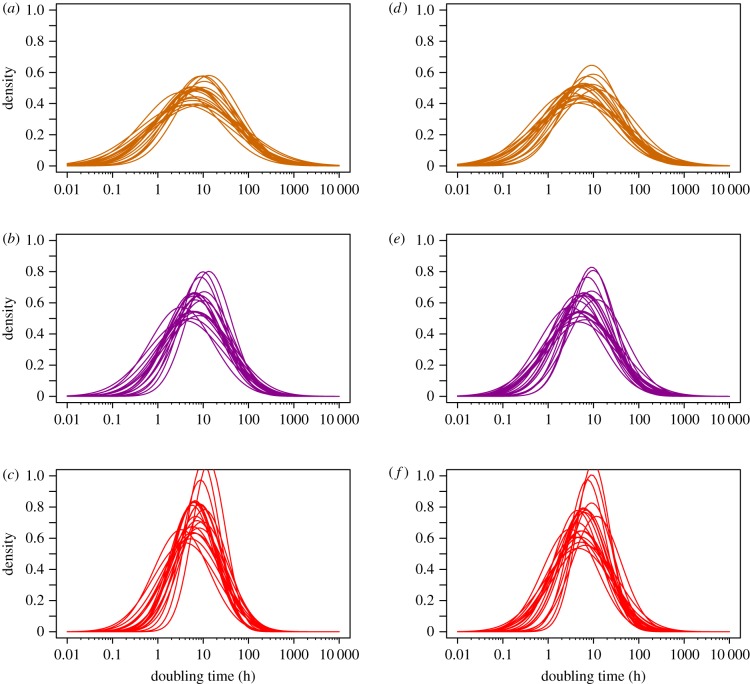
Figure 3.
DT distributions inferred by bootstrapping the accumulation and mutation rate data and refitting the lognormal distributions to both datasets. Each plot shows 20 bootstrap DT distributions assuming different levels of correlation between the accumulation and mutation rates—orange r = 0, purple r = 0.5 and red r = 0.75. (a–c) Include all mutation rate estimates and (d–f) show the analysis after removal of the Mesoplasma florum mutation rate estimate. (Online version in colour.)

