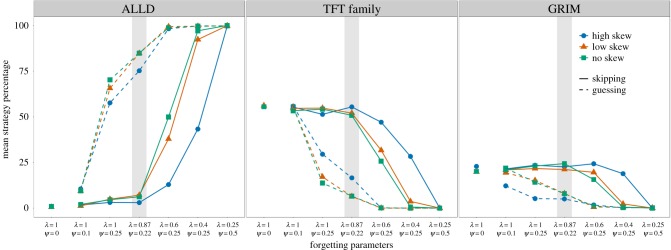
Figure 2.
Mean percentage of each strategy in the population varied based on level of skew in contact pattern (no skew, low skew, high skew), forgetting rate (λ specifies starting point, ψ specifies decay rate) and type of memory error (guessing or skipping). ALLD represents all defect strategy. TFT family sums the percentages from strategies tit-for-tat, tit-for-two-tats, generous tit-for-tat and contrite tit-for-tat. GRIM represents grim trigger strategy. Standard error of the mean error bars are not shown because they are smaller than the data point symbols. (Online version in colour.)

