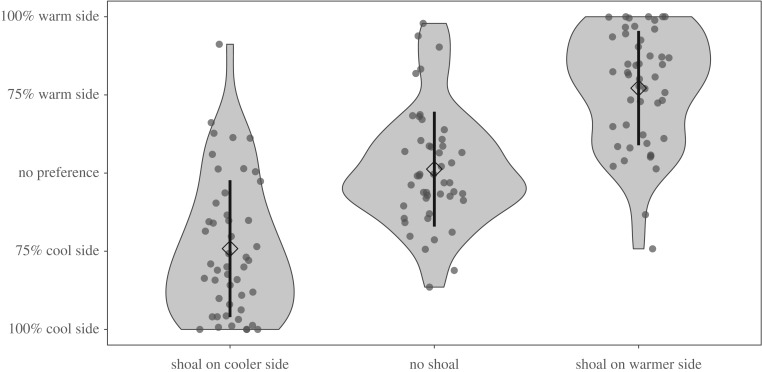
Figure 2.
Compared to their position when no shoal was present, animals spent significantly more time on whichever side the shoal was located (LME; F2,68 = 81.66, p < 0.001). This violin plot shows where, on average, fish spent time in the two-chambered tank under three experimental shoal positions. Each point represents one individual fish. Diamonds represents the mean ± s.d. The width of each violin represents observation density at that y-value.

